How To Create Event Tree Diagram
Event tree diagram is the graphical representation of the model that identifies the possible outcomes following an initiating event. It's easy to create event tree diagrams with Edraw.
Step 1: Define the Events
Open a new drawing page in Edraw, go to Insert menu, click Table button and insert an one-row table.
Input the initial event in the first cell and outcome in the last cell. Put the subsequent events in the middle cells.


Step 2: Draw Tree Structure
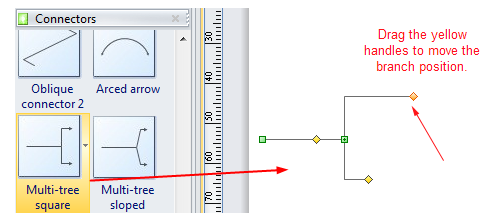
To draw the tree structure, you can use the tree connector symbol in the Connector library.
The tree connector symbol is flexible to change the branch position by moving the yellow control handles.

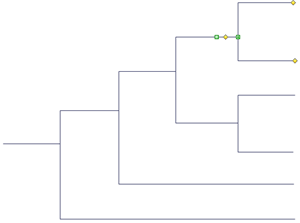
Add more tree connectors and complete the tree structure.

Step 3: Add Texts to the Event Tree
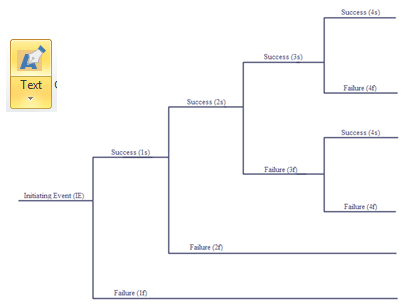
Using the Text button, you can add text anywhere on the diagram.
Go to Home menu, click Text button, and draw text blocks on desirous position of the chart.

Step 4: Add Swimlanes
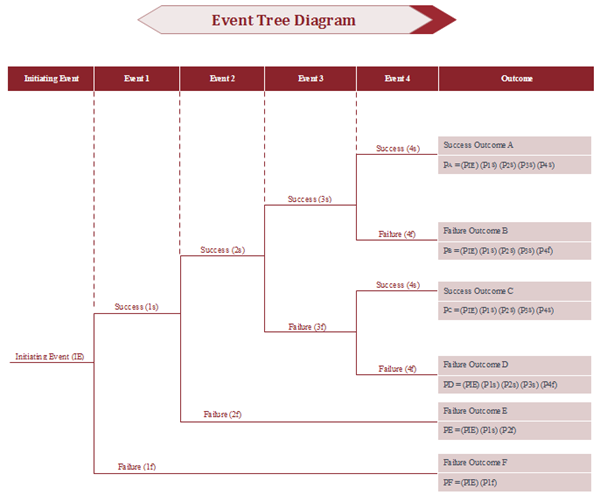
Add swimlanes to make the tree structure strictly aligned with the table using dash lines.
Go to Home menu, click Line button, and draw lines on desirous positions. Set line weight and dashes in the Line option list.
The event tree diagram is done.

Step 5: Export the Event Tree
Edraw offers a variety of possibilities to export your event tree. Go to File menu, and then click Export and Sent, and you will see lots of export options including Word, PPT, Excel, PDF, Html, PNG, etc.

Discover why Edraw is an awesome event tree diagram creator: Download it Now.
What is the Event Tree Analysis?


