Simple Guides to Create Dendrogram
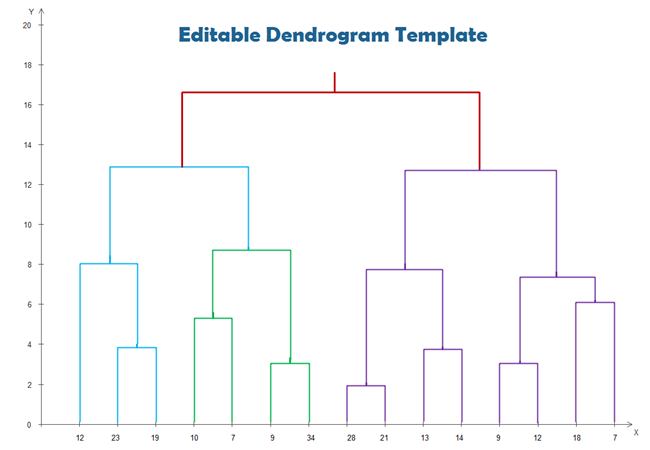
A dendrogram looks like a tree chart. It is composed of an X-Y axis and several clusters. The vertical axis is labelled distance and refers to the distance between clusters. The horizontal axis represents the numbers of objects.
Steps to Create Dendrogram
Step 1: Download dendrogram template and open it.
Click the following image to download Dendrogram Template, and open with Edraw.
Step 2: Edit the X-Y Axis
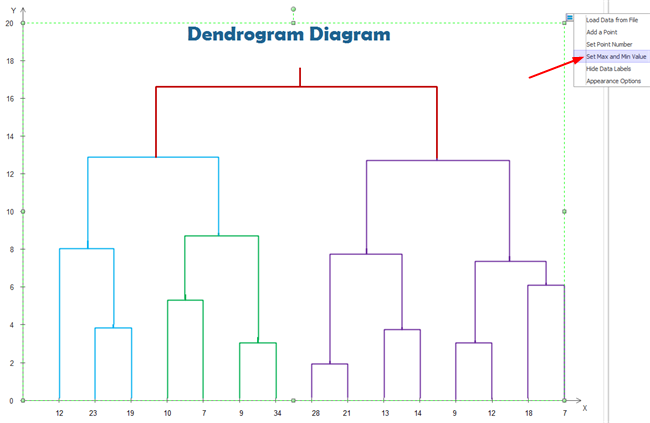
Click on the axis, you will see a floating button on the top right corner. Hit on the button to open the context menu.
-
Set the Y-axis max value. Choose the "Set Max and Min Value" option.
-
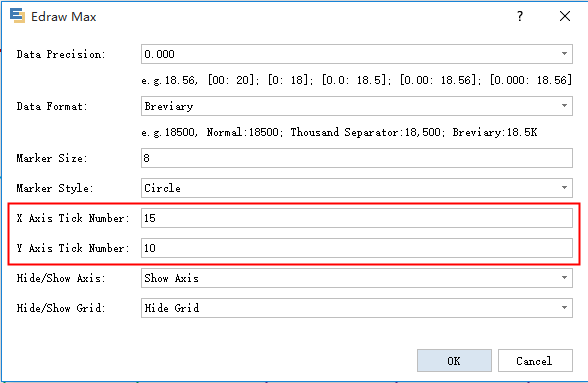
Set X-axis and Y-axis tick number, click the "Appearance Options", and from the pop-up dialogue, change the tick numbers.
-
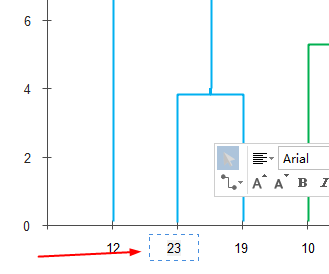
Double click on the number label to edit numbers on X-axis.
Step 3: Edit the Clusters
All the clusters can be edited on the length, position, etc. You can use the clusters on the template. You can also drag new cluster from the Connector library in Edraw.
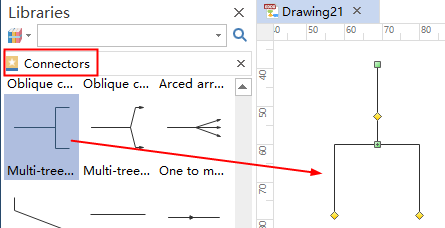
Drag the yellow handles to change the length of each cluster.
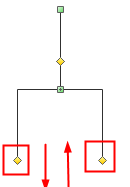
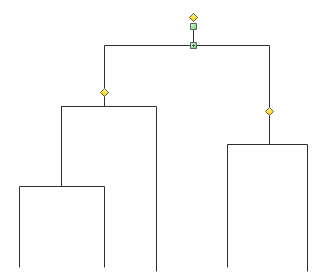
Draw the clusters one by one. Start from the bottom and joint one another until the top.
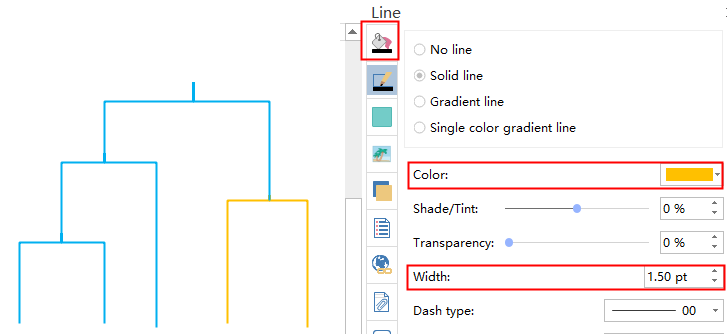
Go to the line setting button to set the line width, colors, etc.
After everything is done, go to the File menu to save the document or export to PDF, PNG, Word and many different formats.

