Choose a Right Chart Type for Making Better Presentation
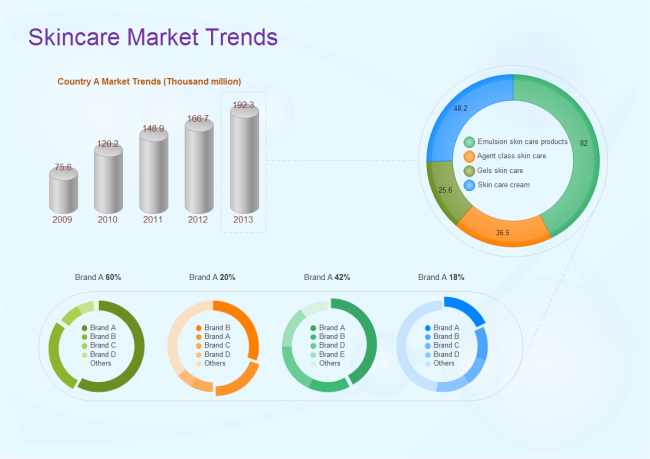
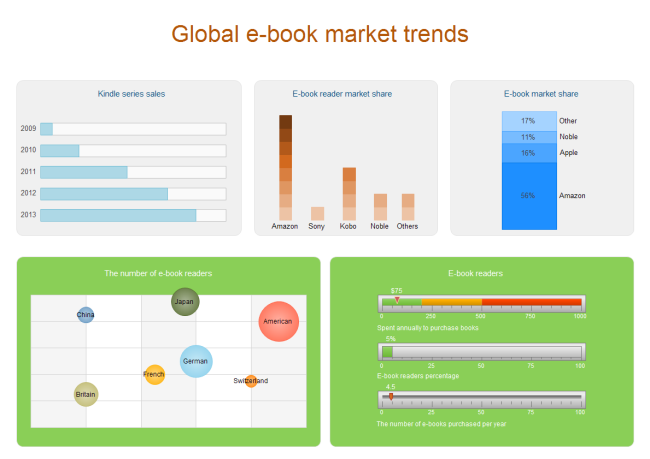
With charts you turn worksheet data into a picture, where you can make a comparison or trend visible at a glance. Many people want to make an attractive, memorable, and effective chart, but have no idea what right chart type is and which chart types they should choose. The truth is that the more types you've seen and tried, the better you'll be able to choose the right one for your purpose.
Why Is Important to Choose Right Chart for Your Presentation?
We use charts to tell stories, evaluate alternatives, understand trends or find out if everything is normal, however, an incorrect charting choice can lead to poor judgment of the messages where as a correct chart can lead to right and faster decisions. Therefore, to make a right decision, it is very important to make the right decision.
Numbers are value data and they do not lie, however, a bad chart decision makes it extremely difficult to understand what the numbers mean. Before you make a presentation, make sure your pick the right type of chart to clearly communicate the information you want to share.
What Is the Right Chart Type for Your Presentation?
Charts help you visualize numeric data in a graphical format but the problem is there are just too many types of charts to choose from. You have bar charts, column charts, pie charts, spider charts, scatter charts, area charts, bubble charts and so on. The question "what is the right chart type for your presenttation" is worthy of thinking.
How to Create Great Charts and Graphs
The chart type which can best convey your message is the right chart type you should choose. For the maximum display of your thoughts and your ideas, it is very important to choose the right chart type for your presentation.
How to Choose the Right Chart Type for Your Presentation?
After you have decided to use a chart, the next question which needs a strong consideration is "which type of chart should you use?" The answer is not as easy as it looks. Very often we see charts which complicate more than simplify. You might not choose a wrong chart but you choose a sub-optimal chart. Which means another chart will do a better job than the one you are using correctly.
To answer the above question, the first and the most important step is to find out what you really want to say in chart preservation. Once we know the clear reason why the chart should exist, we will naturally be able to select the correct chart type for that reason. Once again, the more chart types you've seen and tried, the better you'll be able to choose the right one for your purpose.
When you're putting together a chart, you're trying to show one of four things with the data you have: a relationship between data points, a comparison of data points, a composition of data, or a distribution of data. First, understand the message you're trying to present with your data. Second, selecting the best arrangement to better display your message is of great importance. Finally, do not forget to format your chart.
Learn more about chart maker or chart software here.
Relative Resources:

