When to Use a Spider Chart
The spider chart is used to compare two or more items under various functions of typical metrics. Check this page to better understand the proper occasion of using a spider chart.
Part1: A Brief Introduction of the Spider Chart
The spider chart (also called the radar chart, web chart, polar chart, and star plots) is named by its unique appearance. It is a chart that uses a two-dimensional graph to display a multi-dimensional data structure. However, it has an extreme limit, which more than two, but no more than six items can be compared. Otherwise, you cannot see the data. Thus, we should explore when the proper occasions of using this chart are.
Generally, the metrics are features or factors to be compared. They are quite disparate from each other. The scores assigned to each metric are relatively scaled – for instance, from 0 to 100, where higher scores indicate better performance under the metrics.
Try an easy and effective Chart and Graph tool for free.
Part2: When to Use a Spider Chart?
Occasion 1 - Several items will be compared with more than 5 metrics of features or characteristics.
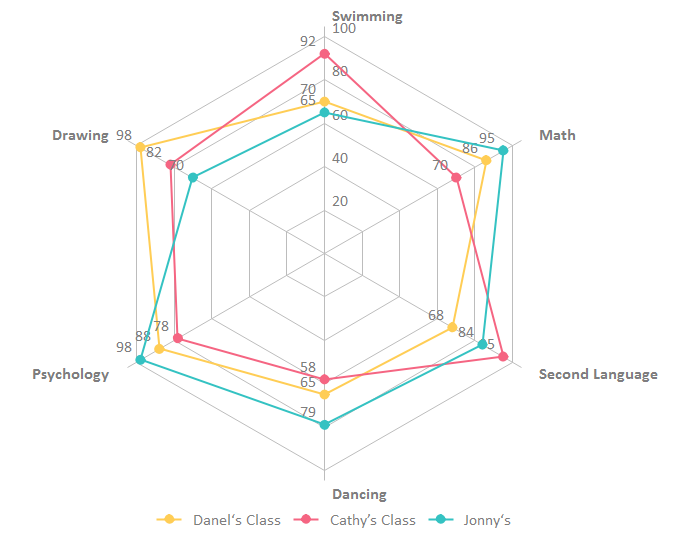
The distinctive feature of a spider chart is the general comparison of all metrics when people need to make a decision. You can judge the cover area and sharp points on the metric lines to have an overall understanding of the pros and cons of those items you want to make. Just take an education issue as an example: If you want to compare the average score of different courses in different classes, you can see the results clearly in the following spider chart.
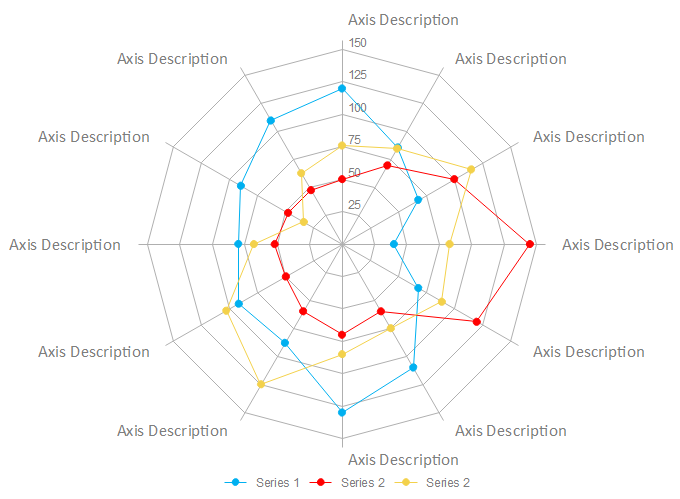
Occasion 2 - The overall situation of different items.
In the spider chart, each item might cover a fixed area based on its data. If you want to see the coverage of each item under different metrics, a spider chart is your best choice. For instance, if a coach wants to know his players’ performances in a match, he can analyze each player's performance in order to have a well-focused training plan.

We can observe from the below situations that several items should be analyzed by different metrics and a spider chart performs perfectly in visualizing those data. Would you like to draw a spider chart like the examples? Please do not hesitate to download and try EdrawMax!

An all-in-one platform for 210+ diagrams.
・ Simple alternative to Visio
・ 26k+ symbols
・ 10K+ free templates
・ 10+ AI diagram generators


Further Reading:


