Chart and Graph Symbols
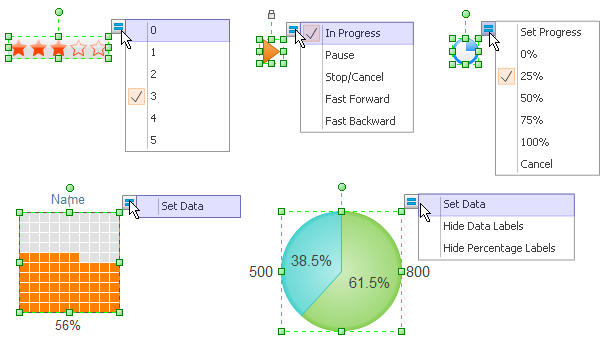
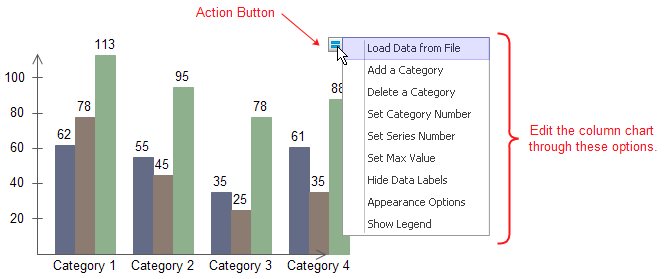
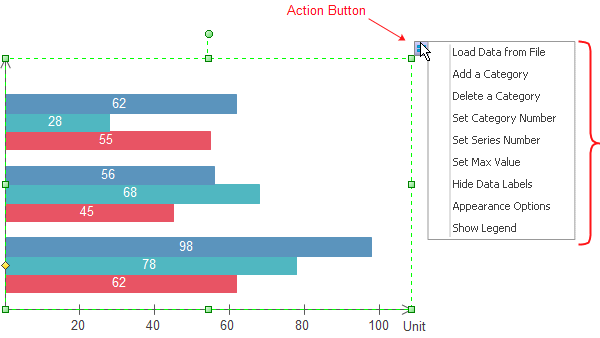
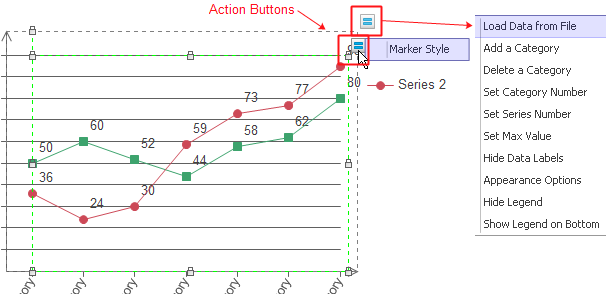
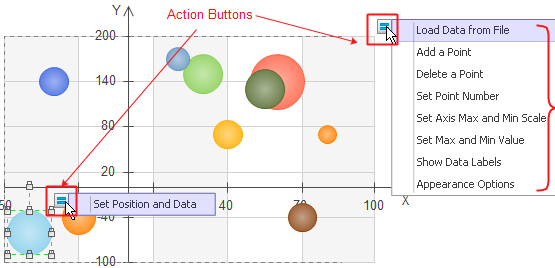
All the chart and graph symbols are highly customizable and rich in options. You can change the category and series numbers from the action button. It will be shown on the top right corner when you select the shape. To change data, just double click on the default data and input a new number.
Symbols for Charts and Graphs
1. Column Chart Symbols
Provide editable column chart symbols including gradient column chart, clustered column chart, 3d column chart, stacked column chart, 100% stacked column chart, etc.

2. Pie Chart and Doughnut Chart Symbols
Offer you a range of special pie and doughnut shapes, including gradient pie chart, gradient percentage pie chart, percentage pie chart, multi-pie chart, pie chart with handle, gradient doughnut chart, multi-level doughnut chart, percentage doughnut chart, doughnut chart with handle, etc.


3. Bar Chart Symbols
Includes plenty of bar chart shapes such as simple bar chart, gradient bar chart, 3D bar chart, cylinder bar chart, stacked bar chart, 3D stacked bar chart, 100% stacked bar chart, etc.

4. Line Chart and Area Chart Symbols
You can find a variety of line chart and area chart shapes, including line chart, 100% line chart, step line chart, area chart, step area chart, line chart with marker, etc.

5. Scatter Chart and Bubble Chart Symbols
You can find templates for both scatter charts and bubble charts in this library.

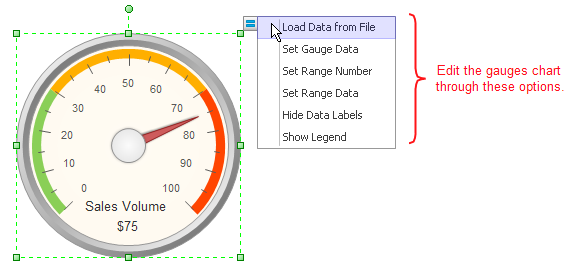
6. Gauges Chart Symbols
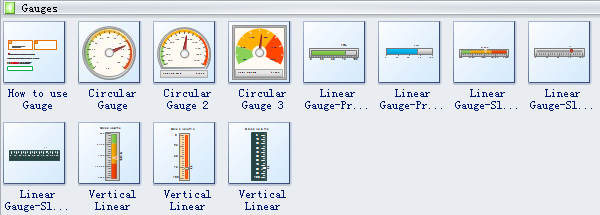
Contain both circular and linear gauges charts.
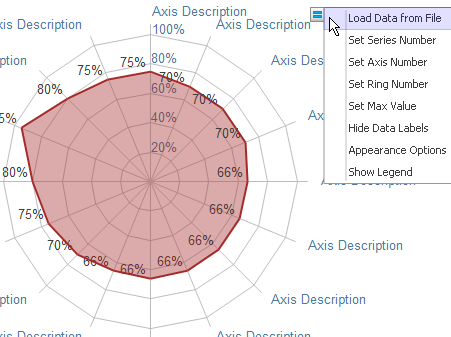
7. Spider Chart Symbols
Five types of spider (Radar) chart symbols are available for different design purposes.

8. Comparison Chart Symbols
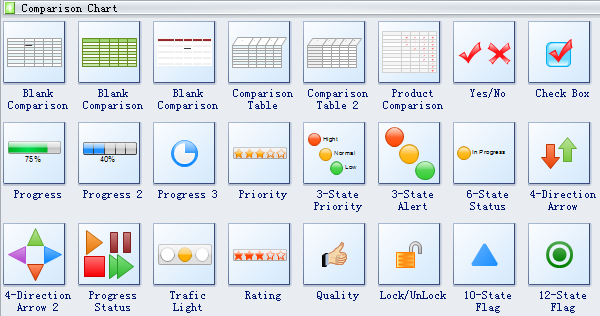
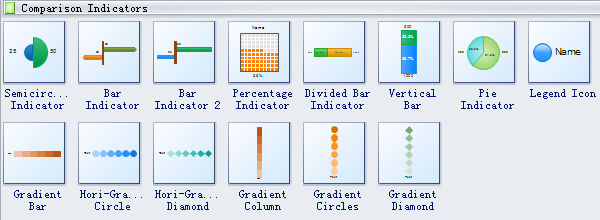
The comparison chart symbol library contains not only the comparison tables, but also the check boxes, progress and priority indicators and many other indicating symbols.
