Cause and Effect Diagram Examples
Edraw Content Team
The cause and effect diagram is an analytical approach where a problem or outcome is examined in the light of potential causes that are organized or broken down into smaller causes or contributing factors. It helps to showcase the relationship between these factors. It is used in quality control and is one of the basic tools, commonly referred to as Ishikawa or fishbone diagram.
There are several instances where fishbone diagram or cause and effect diagram can be applied, especially in manufacturing processes or different business scenarios. For instance, if a printer is giving faulty printouts the causes are looked at. These could be quality of paper, printer cartridge not working properly, inbuilt printing program having a glitch and so forth.
Another example of a cause and effect diagram changes in climate conditions of an area. Since different factors cause such changes over time, one needs to look into related geographical factors, the pattern of changes in wind, air and water conditions in order to see how all the interrelated factors lead to climate change.
What is the Cause and Effect Diagram?
The cause and effect diagram helps to examine the different potential causes of a problem or situation. With this quality control tool, one can examine the contributing factors as categories and subcategories. EdrawMax offers readymade fishbone diagram tools or templates. It becomes easy to customize the same and one can use these templates for free. What's more, once the templates are used they can be converted into PDF, Word, and PowerPoint as well.
Key Points of Cause and Effect Analysis
When it comes to cause and effect analysis it can help to identify key points. For instance, when one is managing a large business there would be problems that would pop up. However, keeping the focus areas in mind helps to align solutions accordingly and quickly find solutions to the same Once a fishbone diagram is drawn it can help highlight the key points and keep them in mind so that problems can be addressed quickly.
Following are key points to remember:
- A brainstorming session will lead to cause and effect diagram or fishbone diagram; this helps to brainstorm and identify causes that are related to a problem and divide them into main categories.
- Every cause or reason has a source due to which variations occur.
- Causes are grouped into main categories which showcase the different variant factors.
- 6Ms to remember for the manufacturing industry are a machine, material, method, manpower, and measurement.
- 8Ps in marketing are price, product or service, promotion, place, personnel or people, packaging, physical evidence, and process.
- 4Ss in service industry refer to suppliers, surroundings, standard documentation, and systems.
Learning from Cause and Effect Diagram Examples
Reasons for Resignation
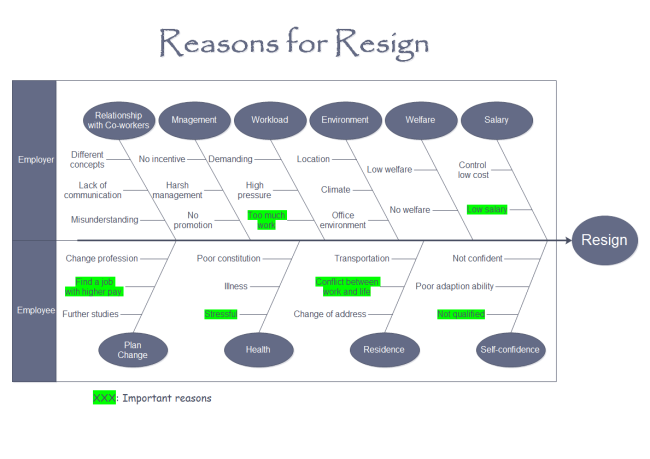
This example used a cross-functional fishbone diagram for delving into the different reasons why employees resign. Each main reason is then shown on either side of the fishbone diagram as from the employee's perspective and from that of the employer.
The main reasons are highlighted in green on both sides. Reasons like too much work, low salary, stress, the conflict between life and work are aspects that management can look into to help counter such problems and reduce their occurrences.
Academic Record
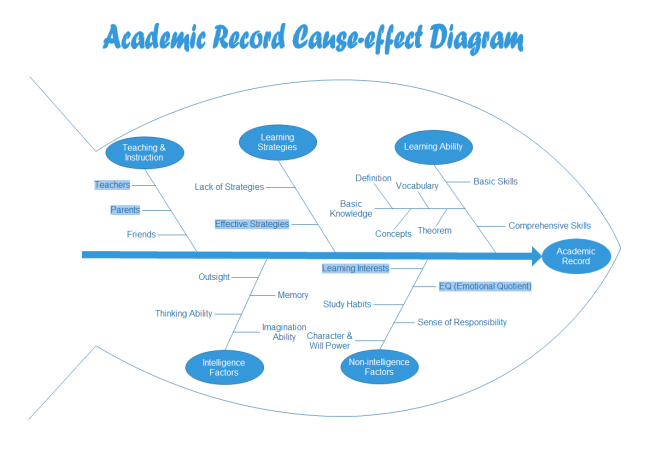
This is another cause and effect diagram shown in a Vector text format. The fish frame has been drawn around the different causes to highlight the formation of a fishbone. Each category that contributed to academic record creation is showcased prominently while their contributing factors are highlighted with fine lines.
As seen here, intelligent and non-intelligent factors are looked at on one side while teaching instruction, strategies and learning ability is showcased on the other side. Their contributory factors or sub causes are shown as to how they contribute to the academic record of a person.
Customer Loss
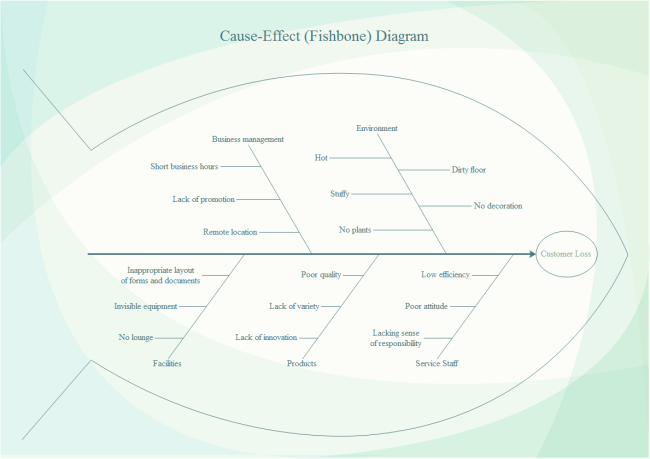
This is another popular instance where problem-solving can involve the drawing of a fishbone diagram. As can be seen here, customer loss is showcased by looking at the different factors that might be causing the problem. The fishbone diagram has been made attractive with an added background. As seen in this diagram, business management, environment on one side and facilities, products and service staff, on the other hand, are contributory factors that might have led to loss of customers.
As causes are analyzed from the different angles and effects of every cause found the fishbone diagram helps to bring together the salient points that can be worked upon to resolve the problem.
EdrawMax
All-in-One Diagram Software
- Superior file compatibility: Import and export drawings to various file formats, such as Visio
- Cross-platform supported (Windows, Mac, Linux, Web)


How to Make a Cause and Effect Diagram?
First of all, we have to download a professional fishbone diagram maker - EdrawMax
With Edraw pre-made templates, it is easy to create a fishbone diagram. The steps to follow are enumerated below:
- Open the application and find File on the menu.
- Open New and find a business diagram; here double click on a fishbone template of your choice.
- Visit the library pane on the canvas's left; find the cause and effect diagram and drag in the fishbone shape on the canvas.
- Drag in category 1 or 2 which could be different shapes such as rectangle categories and others; position the category shapes such that the arrowheads touch the fishbone.
- Next step would be to label categories; double click on Text and type in the words.
- Select a shape and delete a certain category.
To show the major reasons that contribute to the different categories drag in the primary because of shapes on the drawing surface; snap-in arrowheads to the lines denoting the categories.
Represent secondary causes that contribute to primary ones; as seen above, drag in secondary shapes on the page and snap in the arrowheads, connecting them to primary lines.
Export
EdrawMax allows support to export the diagram formed to other formats; you can easily export it to programs like PDF and Microsoft Office. On ‘File Menu’ the option ‘Export & Send’ can be used for such functions.
Other Features
- Decide who are the stakeholders, people affected or responsible.
- Customers, suppliers, managers.
There are different features that EdrawMax provides so that themes and other effects can be added. The whole diagram can be changed by a few clicks on the active theme option. Most of these documents are graphic vector files; they can achieve high clarity as well as provide easy features for modifying and reviewing. Smart tools are provided that help formatting easy. One can use formatting functions like rotate, align and group different objects. Customization options are several such as adjusting line color and width as well as font size, style, text color, and others. It is also easy to add on images and photos as well as editing the text fields.
Summary
The above examples of cause-effect diagrams show how this quality control tool can help in problem-solving in different business or other situations. If you have other wonderful examples of cause and effect diagram, feel free to share with us.

Edraw Content Team

