Bubble Diagram Tutorial
- Part 1: What is a Bubble Diagram?
- Part 2: Purpose and Benefits of Bubble Diagrams
- Part 3: Things to Consider before Working on Bubble Diagrams
- Part 4: How to Make a Bubble Diagram Like a Pro with EdrawMax?
- Part 5: Expert Tips for Making Bubble Diagrams
- Part 6: Another Bubble Diagram Example to Learn from
Part 1: What is a Bubble Diagram?
A Bubble Diagram is a simple brainstorming or learning visual tool that draws different entities and establishes dedicated relationships between them.
Due to their diverse appeal, Bubble Diagrams can be used to represent multi-dimensional data in the form of a scattered plot. That is, you can use a Bubble Diagram to individually discuss various elements and further draw relationships between them. Ideally, a Bubble Diagram consists of two import components:
Entities: They are represented by bubbles (circles) and would depict the major topics or concepts that we need to cover. A single entity can be divided into sub-entities, depicting an instance, example, or any other piece of information.
Relationships: To represent a relationship (like dependencies), we draw arrows from one entity to another. This would let you depict the overall flow of the structure in your visual tool.
Since there can be different topics to cover in a Bubble Diagram, we distinguish them by using dedicated colors or by adjusting the size of the circle.
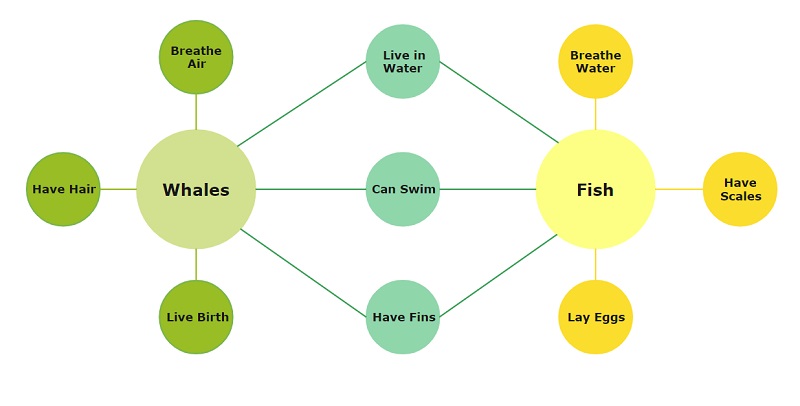
Here, you can see an extremely simple Bubble Diagram that can depict the difference between whales and fishes. At first, both the entities are identified and are represented by different colors. We have tried to identify the differences for each entity and have also represented the similarities in the middle. Therefore, with just a single glance at this Bubble Diagram, anyone can know the difference and similarities between whales and fishes.
Part 2: Purpose and Benefits of Bubble Diagrams
In nutshell, Bubble Diagrams are used to depict the relationship between different entities and explore them in detail. Due to their diverse appeal, Bubble Diagrams are extensively used in almost every domain these days. If you want, you can also take the assistance of Bubble Diagrams due to the following key benefits.
• The Ease of Construction
One of the best things about Bubble Diagrams is that they are pretty easy to make. You don’t have to follow any strict rules while working on them and they can be drawn as per your requirements.
• Dynamic and Easy to Extend
As you can see, Bubble Diagrams are mostly focused on the main entities and topics that we wish to cover. Since there is no set of pre-fixed entities or topics, we can add more relationships or content on the go.
• Self-Explanatory
Just like other brainstorming visual aids, Bubble Diagrams are also extremely easy to understand. Anyone can check the overall relationships between the entities added in a Bubble Diagram without any hassle on their own.
• Brainstorming and Concept Analysis
A lot of people take the assistance of Bubble Diagrams to carefully examine anything. For instance, you can explore the sub-branches of any topic or explain the hierarchy of an organization. These diagrams can also be used to draw differences or similarities between numerous topics or explain the flow of work.
• Multi-Dimensional Representation
Unlike other basic visual tools, Bubble Diagrams can be used to depict the connection between different dimensions. You just need to allocate a bubble set to dedicated topics and draw relationships between them. Following this, you can draw relationships between as many components as you want.
Part 3: Things to Consider before Working on Bubble Diagrams
As I have listed above, Bubble Diagrams are user-friendly, and you won’t need prior technical experience to work on them. If you want, you can follow this three-step process to come up with any Bubble Diagram easily.
1. Identify the Primary Entities
The first thing you need to do identify the primary topic of your Bubble Diagram. For this, chances are that you might have to compare two or more entities together or just focus on a single concept. Once you identify these entities, you can draw dedicated bubbles for them and even allocate them to individual colors.
2. Focus and Branch-out
Great! Now when you know the major topics to cover, you can focus on one topic at a time. Start from the first thing that you wish to explore and draw smaller bubbles around the primary topics. These smaller bubbles can further be branched out, as per your requirements.
3. Draw Relationship Between Entities
In the end, you can just link different entities (primary and sub-branches) using directional arrows. For instance, you can draw arrows from the primary bubble to its branches for linking them. There can be different dependencies and relationships that you can depict with arrows.
Part 4: How to Make a Bubble Diagram Like a Pro with EdrawMax?
If you also want to come up with visually appealing Bubble Diagrams, then I would recommend using Wondershare EdrawMax. A dedicated diagramming tool, it has thousands of vectors that can help you create hundreds of different styles of diagrams. The application also has a wide range of templates that you can readily use or create new diagrams from scratch using its resources.
EdrawMax
All-in-One Diagram Software
- Superior file compatibility: Import and export drawings to various file formats, such as Visio
- Cross-platform supported (Windows, Mac, Linux, Web, Android, iOS)


Since EdrawMax is extremely easy to learn, you can start working on all kinds of Bubble Diagrams without any hassle. All you need to do is launch EdrawMax on your computer and follow these steps:
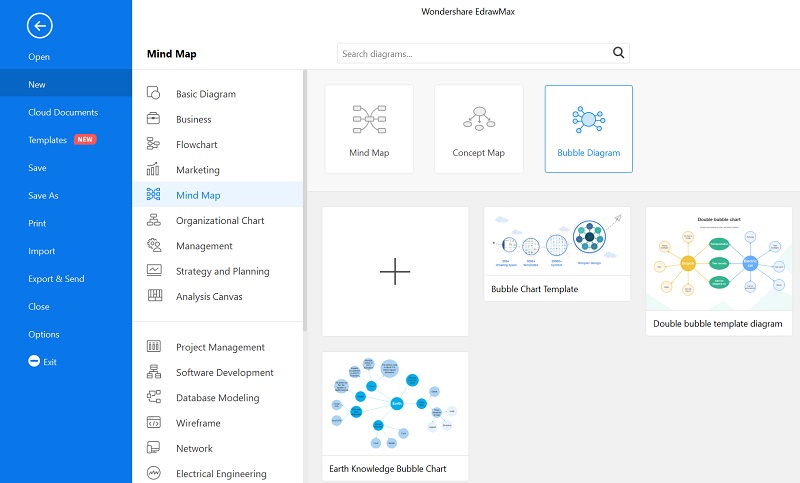
Step 1: Set up a New Project (or use an Existing Template)
To start with, just launch Wondershare EdrawMax and enter details about the new project. You can click on the “+” icon to work on a new canvas from scratch or view any available templates under Mind Map > Bubble Diagram.
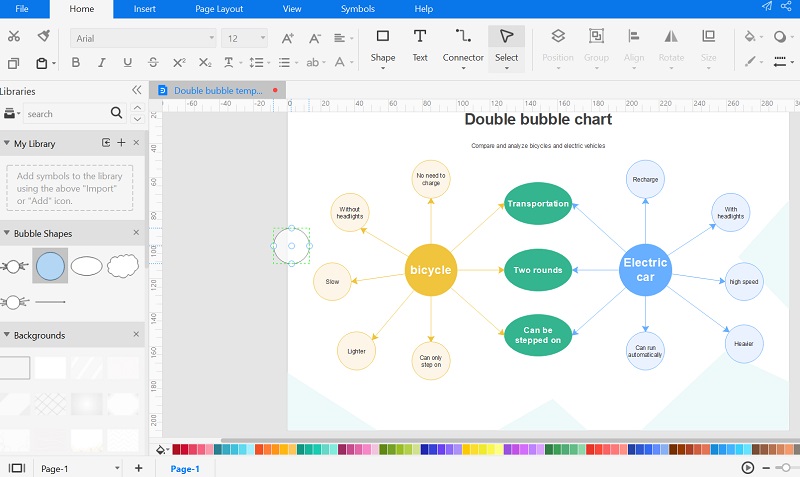
Step 2: Start Working on the Bubble Diagram Construction
If you have loaded a template, then you can just make the needed changes in it to customize your Bubble Diagram. Besides that, you can find all sorts of vectors related to Bubble Diagrams that you can drag and drop to your canvas.
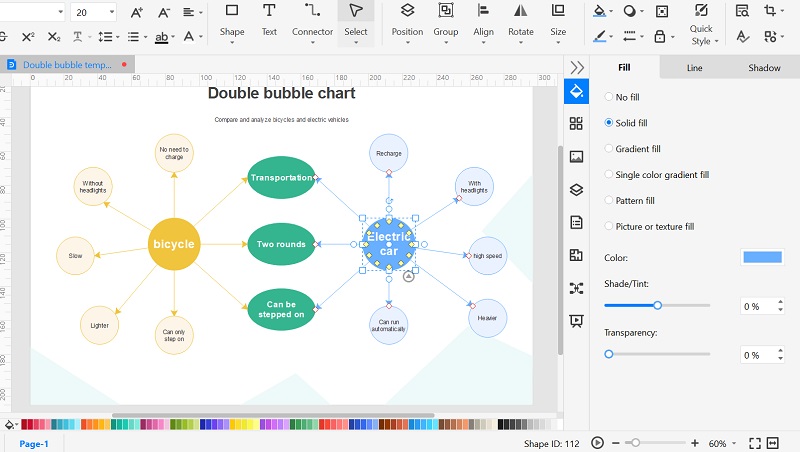
Step 3: Make Changes in the Overall Appearance of your Bubble Diagram
After making the overall structure of the diagram, you can select any vector and view all sorts of formatting options on the sidebar. From here, you can change the background color, fonts, and make other changes as per your requirements.
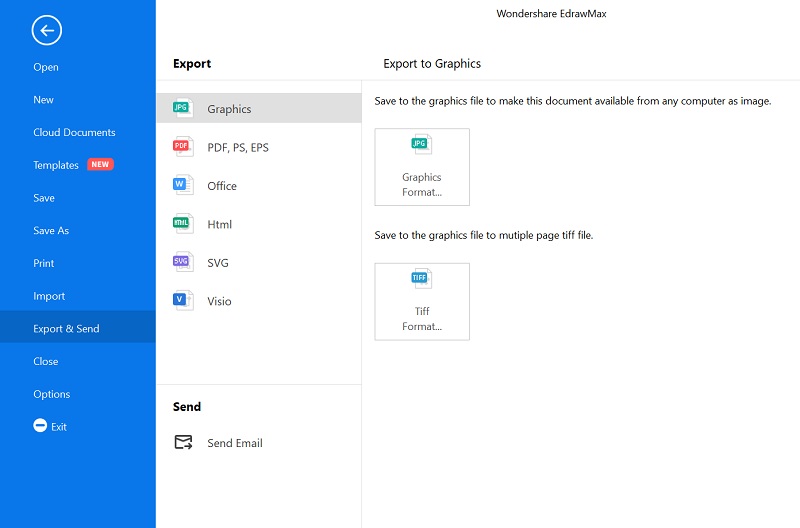
Step 4: Save and Export your Bubble Diagram
That’s it! Once you have completed working on your Bubble Diagram, you can save the changes on EdrawMax. You can also click on the Export icon from the top and save your Bubble Diagram into different formats (like PNG, PDF, HTML, and so on).
Part 5: Expert Tips for Making Bubble Diagrams
Even though working on Bubble Diagrams is pretty easy, you can consider the following tips to get better results.
• Since Bubble Diagrams can be extremely extensive at times, try to limit them and focus on the things you need to cover essentially.
• Keywords are extremely important in Bubble Diagrams and they should be chosen selectively. Try to include keywords that are simple, relevant, and precise.
• Color coding is important in Bubble Diagrams as well. This is because you can just divide topics into different categories by allocating them to individual colors.
• Apart from coloring, you can also consider the overall size of the bubbles and focus on primary bubbles by making them big.
• Consider using any professional diagramming tool like Wondershare EdrawMax that would make the entire process easier.
Part 6: Another Bubble Diagram Example to Learn from
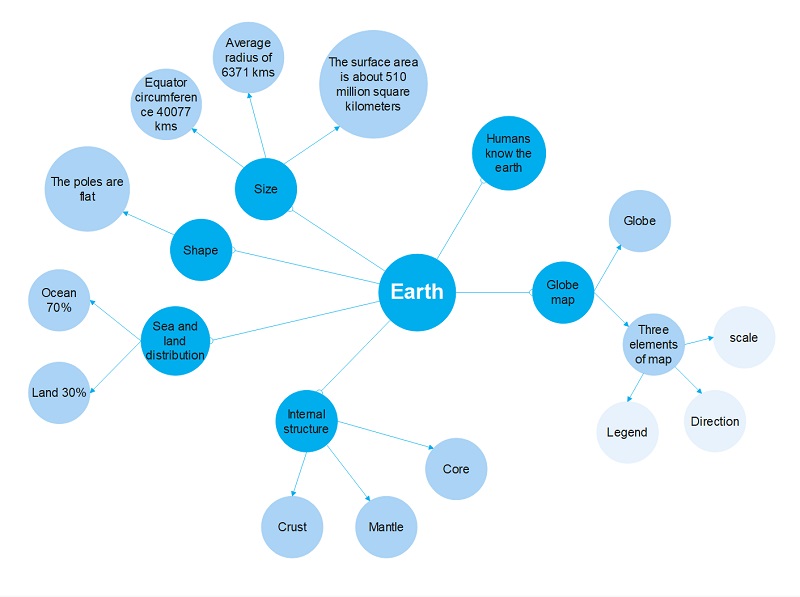
Before we conclude, let’s quickly have a look at another Bubble Diagram example. In this diagram, we have tried to explain the structure and composition of the earth based on different parameters. There are dedicated branches to explain the global map, shape, size, internal structure, and other components.
These entities are further explored to provide a layered approach (like the sea and land distribution). Anyone can have a look at this Bubble Diagram example to understand tons of details about our planet without putting in much effort.
This brings us to the end of this extensive guide on Bubble Diagrams, including their meaning, benefits, and professional tips. Apart from that, I have also come up with a step-by-step approach for creating Bubble Diagrams from scratch with a tool like Wondershare EdrawMax. As you can see, using this diagramming application is extremely easy and it features numerous templates, vectors, and other designing tools. You can instantly use its vectors and inbuilt features to create not just Bubble Diagrams, but hundreds of other diagrams easily.

