Use Brainstorming in Six Sigma Program
What is Brainstorming?
Brainstormin is a popular technique used to generate new ideas and possibilities. It's a classic method widely used in business activities such as problem solving, failure analysis, new product ideas, sales increasing, product improving, etc. In Six Sigma, brainstorming is usually most valuable during Define, Analyze and Improve phases.
When to Use Brainstorming?
- When a broad range of options are desired.
- When creative ideas are desired.
- When participation of an entire team is desired.
EdrawMind
Full-Featured Mind Mapping Software
- Cross-platforms supported (Windows, Mac, Linux, Web)
- Brainstorming mode and presentation mode
- Group & real-time collaboration
Multiple Brainstorming Tools
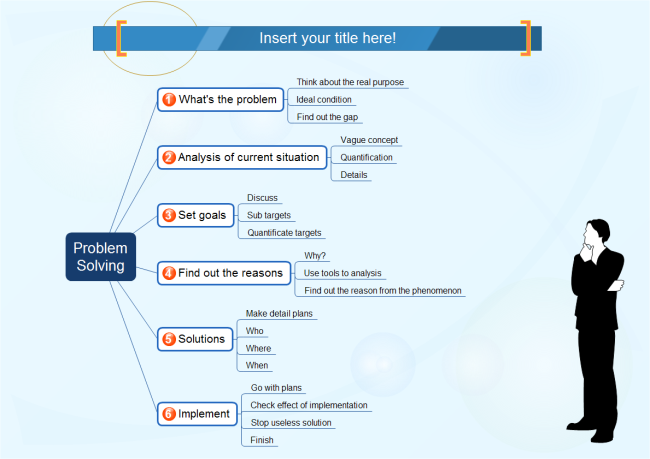
As a matter of fact, a variety of diagrams can be seen as effective brainstorming tools, including brainstorming mind maps, affinity diagrams, fishbone diagrams and so on. Read the following example to have a deep understanding of brainstorming.
Brainstorming Diagram
A brainstorming diagram contains a root at the center with branches radiating from it, which can best represent brainstorming ideas. It is a visual thinking tool that helps structuring information, helping you to better analyze, comprehend, synthesize, recall and generate new ideas. Edraw gives an easy solution in creating good looking brainstorming diagrams. It offers lots of high-quality brainstorming diagram examples and templates, aiming to help people visualize their thinking with the least effort. View more brainstorming examples and download a template best suits you from the template page.
Discover More Six Sigma Tools and Templates
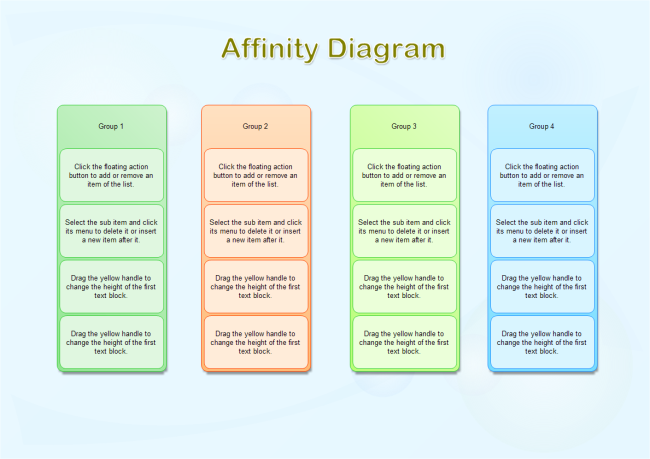
Affinity Diagram
An Affinity Diagram is a tool that gathers large amounts of language data (ideas, opinions, issues) and organizes them into groupings based on the ir natural relationships. Use an affinity diagram to pull in many ideas from a group of participants before they are influenced by what others say.Below you can click the picture and download this affinity diagram template for your own brainstorming process.It's in vector format, available to modify and redesign. Easy to change the text box number, resize the boxes and change the diagram appearance.
Fishbone Diagram
Fishbone diagramis a visualization tool for categorizing the potential causes of a problem in order to identify its root causes.It's one of the most basic yet powerful tools in brainstorming session. If you are looking for a nice fishbone template, simply go to fishbone example page, there are plenty of ready-made fishbone diagram templates available in use.

More Resources
Use Pareto Chart for Six Sigma Process Performance Measuring


