Trusted By Over 30 Million Users & Leading Brands

cmpa
mckesson
deloitte
amazon
facebook
apple
puma
nike
sony
pilz
ge
kpmg
fujifilm
mitsubishi_electric
ublox
daimler
toyota
walmart
harvard_university
glencore
at&t
amerisource_bergen
aramco
shell
total

Why EdrawMax to Make Your Bar Graphs?

Bar graphs for every need
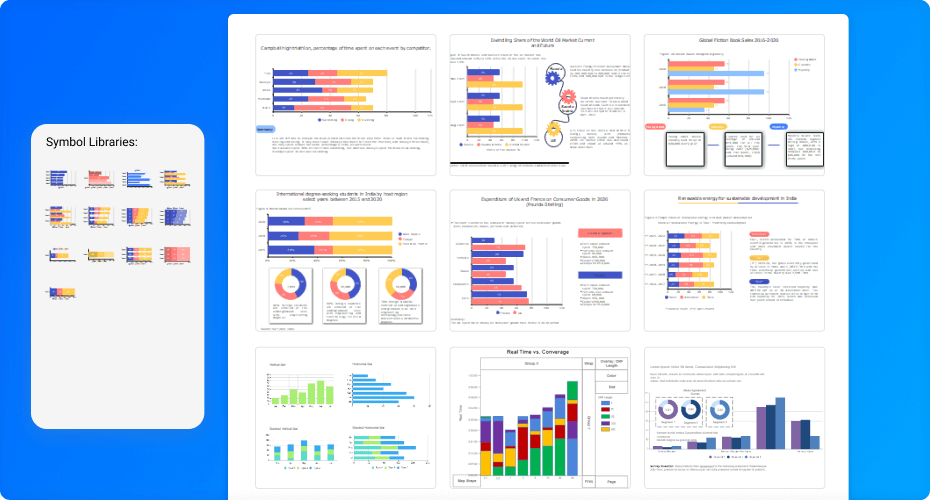
Show how things relate: A bar graph is the most common graph in business and statistics. It's an excellent tool to show the relationship between different parts.

Compare over time: Show changes in different parts over time. You can use a bar graph if you want to show the number of new disease cases over time.

Easy to understand: If you're a business owner or manager, you want to understand the data you're looking at. That's why a bar graph is so helpful. You can see the data quickly and easily.

for every need

Creating bar graphs is a breeze
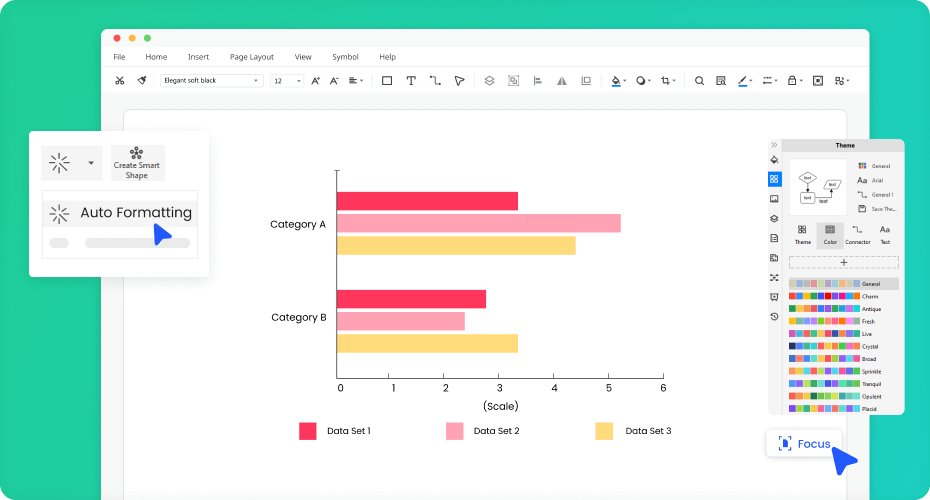
Ready-made templates: With EdrawMax, you can use templates for graphs you want to create. So you don't have to waste time making each one individuall.

Data import & export: Convert data to chart & chart to data quickly. The best thing about EdrawMax is that you don't have to import your data from another software to create a bar graph.

Custom brand color palettes: It's easy to customize your brand colors in the EdrawMax. Go to the palette tool, click on the top button in the toolbar, and select a brand color.

create with EdrawMax

Store and share extremely easy

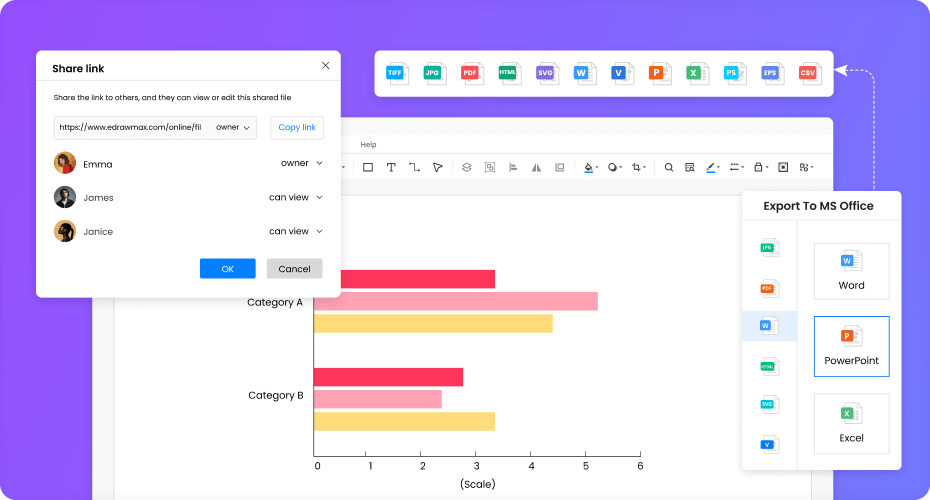
Export final files: XLSX/DOCX/PPTX/PDF/HTML/RTF/HTML are all options you can choose from when you export your graph. You can also export your graph as a PNG or JPG image.

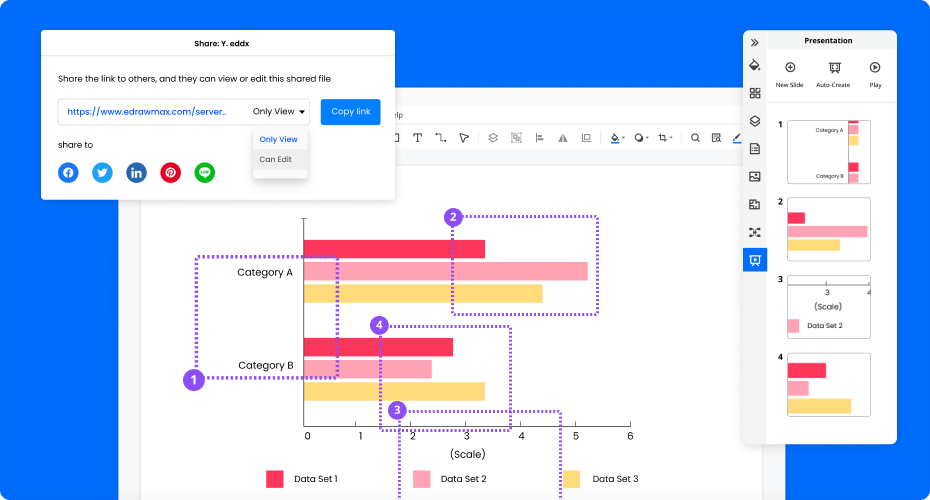
Share your creativity : It's really smooth to share your graph creations with colleagues and friends. Just save your graph as a file and send it to them.

Free cloud storage: You can store all your graph templates in the cloud, which is 100 MB for basic accounts. When you upgrade to lifetime users, you will get 10GB cloud space!

collaboration

Print, present and what next?

Outstanding printing tools: EdrawMax graph bar maker offers an outstanding range of printing options. And the ability to print directly to a PDF file is a huge time saver.

Embed graphs: Embedding a graph in your presentation is as simple as dragging the graph from the menu bar to your presentation and dropping it where you want it to go.

Make presentations: If you want to create a professional presentation without using PowerPoint, EdrawMax is the software you need. Just try the handy presentation tool!

presentation

More Features Of Bar Graph Maker

Visio files import and export
Customized fonts and shapes
Insert images and attachments
Infinitive canvas
Various color theme
File encryption and file backup

EdrawMax is a bar graph maker that can create professional-looking graphs. With a wide range of customization options, this software will allow you to create graphs that can be used in presentations, scientific papers, or any other type of document.

The Bar Graph Maker is a cool tool for those who want to add bar graphs to their presentations. The software allows you to quickly and easily create graphs that can be easily customized and easy to read. If you're looking for a tool to add to your toolbox, this is a great choice.

Impressed by the ease of use, the simplicity of the program, and the ability to work with many data points. I am a beginner, and this program is very user-friendly. EdrawMax is the best tool I have ever used for creating bar graphs.

Edraw Bar Graph Templates

Bar Chart
Bar Chart
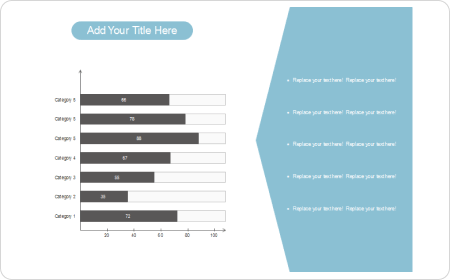
The bar chart template is perfect for when you have a lot of different bars to show.
Bar Graph Example
Bar Graph Example
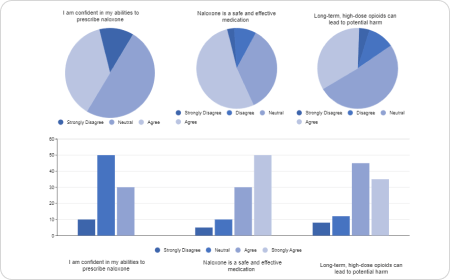
When creating a bar graph, you need to make sure that the bars are distinguishable. This is where the bar graph example templates in EdrawMax come in handy.
Stacked Bar Chart
Stacked Bar Chart
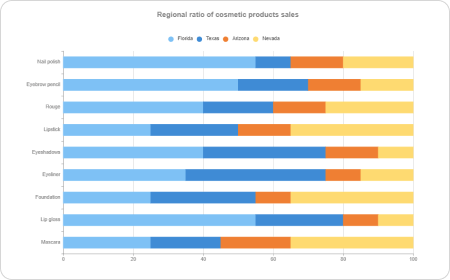
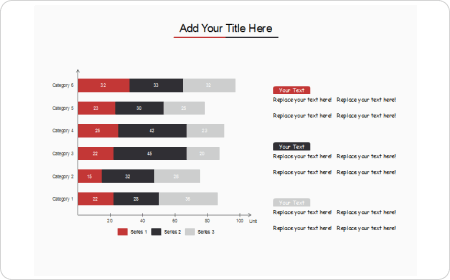
This is one of the most common bar graphs you'll use in your business. A stacked bar chart is a bar graph showing each bar as a separate entity, representing a different data value.
Horizontal Bar Graph
A horizontal bar graph is typically used to show the number of items or sales of an item in a given period.
Vertical Bar Graph
Vertical Bar Graph
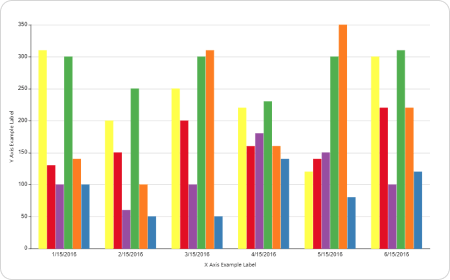
A vertical bar graph is a simple way to display your data. You can use it to display data representing your measurements or simply organize the data.
Clustered Bar Chart
Clustered Bar Chart
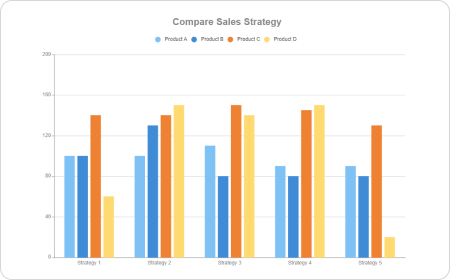
This is a good option for those looking for a more abstract graph. It has a lot of options for styling the graph and can be made to look very professional.

Bar Graph FAQs

Except for the pre-made bar chart templates in EdrawMax, you can download and customize templates from our Template Community. All the community-made templates are free to use for Edrawers.
When your bar chart is complete, you can post it on social media, publish on Edraw Template Community, or export the file as Word, Excel, PowerPoint, Visio, PDF, SVG, PNG and JPG. EdrawMax is dedicated to delivering a superior user experience.
No worries. You can find bar chart symbols by opening and searching in the preset symbol libraries of EdrawMax.
You can create a bar chart from scratch by dragging and dropping symbols from the libraries and customizing colors, fonts, lines, etc. All the symbols in EdrawMax are vector, editable, and catered to different types of bar charts.
YES! It is free to create different bar charts in EdrawMax. There are free templates, symbols, and easy-to-use editing tools for making bar graphs. Just download it and try EdrawMax now. You will love it right now.

More Resources

Unlock your diagram possibilities by exploring more diagram makers here.
Find more ideas, tips and knowledge to help create bar graphs.
Need help? Find the instruction or contact support here.