WBS Chart Complete Guide
Edraw Content Team
Do You Want to Make Your WBS Chart?
EdrawMax specializes in diagramming and visualizing. Learn from this WBS chart complete guide to know everything about the WBS chart. Just try it free now!
Dealing with difficulties while managing a team, resources and tools is a daily practice for a project manager.
However, if you apply the 'Divide and Conquer' strategy to your gigantic professional projects, winning more clients and closing bigger deals will be a piece of cake for you. In corporate words, it is called creating a WBS chart. You divide a big project into smaller milestones and conquer them.
This approach helps divide a big task into subtasks and motivates the team to complete each milestone promptly. Completing the work packages at a particular level is centered on achieving the deliverables on the class preceding it.
1. What is a WBS Chart?
The Work Breakdown Structures are primarily in place to make things go smoothly during project management. Without a proper structure, measuring a workflow's progress, efficacy, and accuracy becomes difficult.
The WBS chart provides a clear picture of the project deliverables and the exact path that will lead the team toward the completion and success of a particular project. Simply put:
A Work Breakdown Structure Chart is an outcome-oriented hierarchical breakdown of the work to be delivered by the team in order to complete a particular project
Millions of project managers swear by this approach, and many research studies back this claim. Most managers like to go with the top-down strategy (discussed later in this blog) for creating such a structure with the whole chart divided into levels per their requirements.
Purpose:
The primary purpose behind going for a structural approach is to organize and identify the deliverable for a particular project. This saves you from missing out on essential deliverables and steps that ensure the success of a project.
Investing your time in WBS planning will improve the quality of the delivered work and set measurable goals for the whole team, making it easier for you to identify what and where something went wrong. Or right.
Go to our Edraw Knowledge to learn more about What is Work Breakdown Structure (WBS) Diagram?
2. Three Types of WBS Chart with Examples
The structural hierarchy of a WBS schedule comprises three basic types. When creating such a structure, you can follow any of the following three approaches to come up with the best option that best fits your preferences:
Phase-Based Structures
A phase-based structure lays great emphasis on the phases of project management, while the final deliverable is given the topmost position in the hierarchy of the structure.
You will find each deliverable in the respective phase of project management where it belongs. The final deliverable is on top of the chart, while the lower levels of the chart showcase the five phases of project management given:
- Initiation
- Planning
- Execution
- Monitoring
- Closure
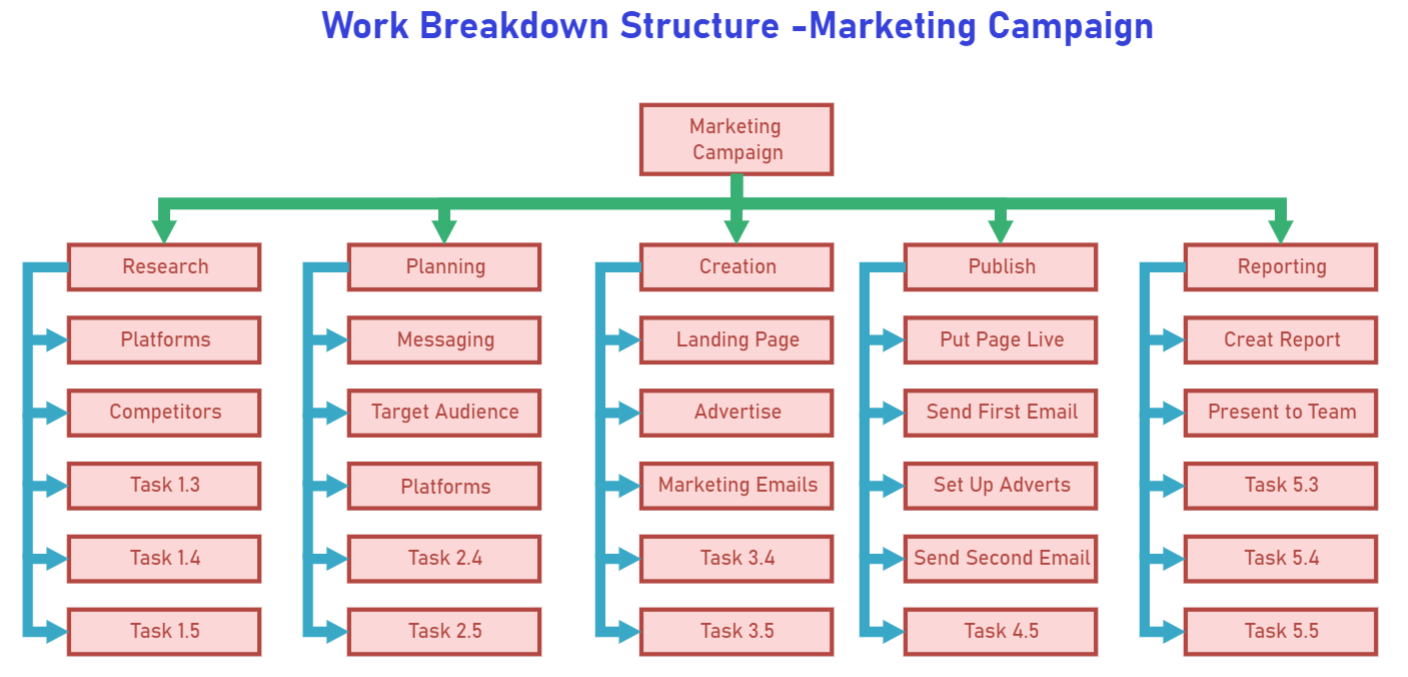
As you can see, the WBS of a marketing campaign consists of 5 phases:
- Research
- Planning
- Creation
- Publish
- Reporting
Deliverable-Based Structures
When in the life cycle of a project, the work packages and deliverables are given the utmost importance at each level of WBS scheduling; it is termed a deliverable-based structure.
The whole project is divided into more minor outcomes or deliverables that are required to complete the work. The deliverables are not defined in terms of work phases but are mentioned individually at each level of such charts.
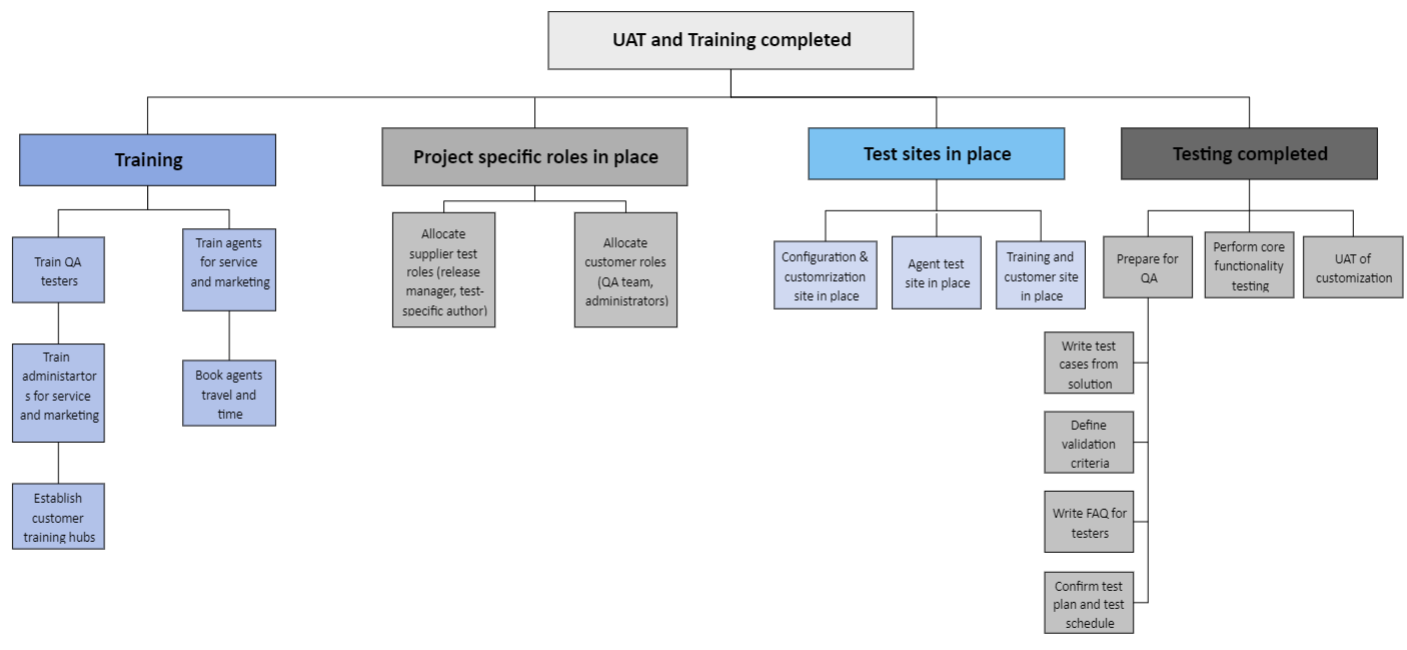
In this case, Training, Project specific roles, Test sites, and completion of the testing are the deliverables involved in the structure.
Responsibility-Based Structures
The third type of WBS chart comprises a structure based on the individual responsibilities of the team members. The departments or team members that manage a particular responsibility are the centers of attention in this structure.
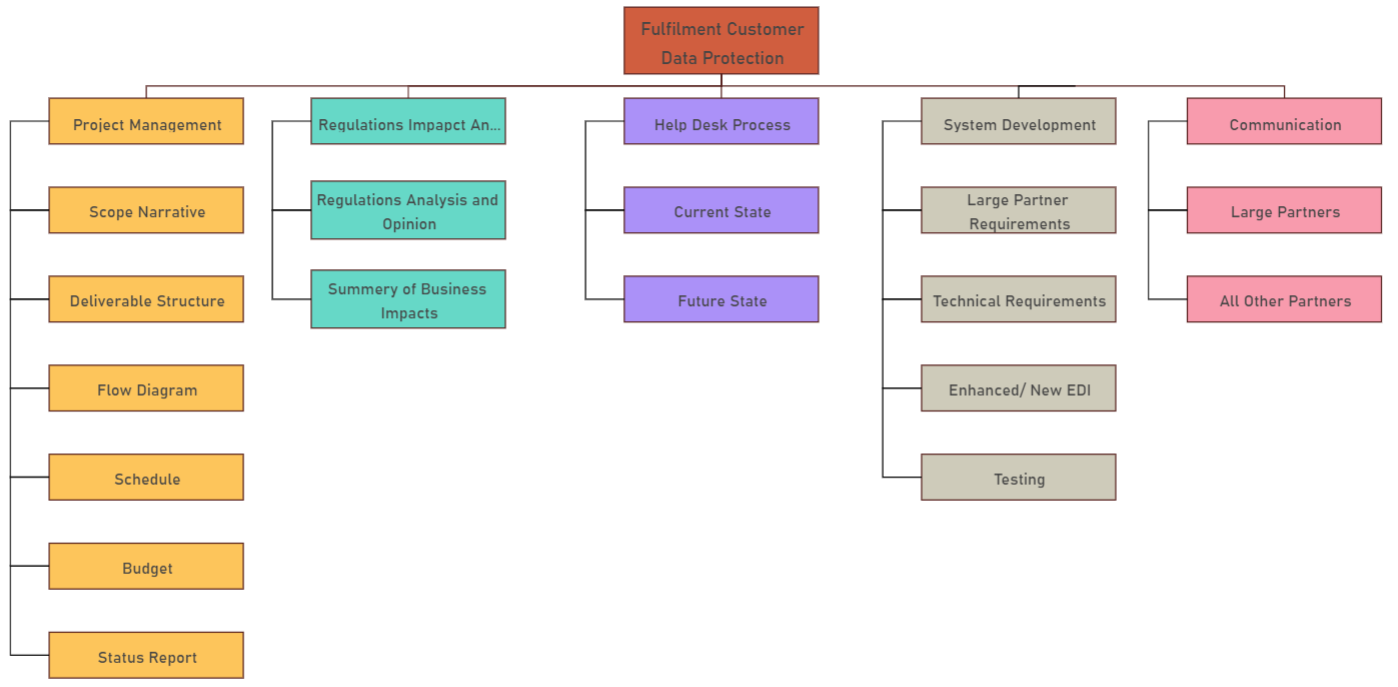
The final task of data protection of the customers is divided into individual responsibilities of each department, given the help desk process, system development, communications, and so on.
You can get more templates from Network Topology Examples & Templates.
Not these, EdrawMax provides more than 12000 free templates in our Templates Community.
3. Spotting a Good WBS Chart
When spotting a good WBS chart, you should look for the characteristics that make any such chart stand out. It should ideally serve all the purposes it is made to cater to. Here's a checklist of things that you would want to tick while looking for a good structure:
Mutually Exclusive
A well-structured chart can be identified through its mutually exclusive components. This means that all the deliverables mentioned in a structure should be placed strategically so that no one deliverable overlaps with another. This is a characteristic that you will find in a professionally drafted chart of this sort.
Completely Exhaustive
The essence of forming a structural hierarchy of a task is to complete it within the deadline and promote the best practices that will lead to its completion without compromising on the quality. This is best achieved when the chart is entirely exhaustive, meaning it covers every aspect of a project from all possible angles. You should be able to find every task that can potentially contribute to the betterment of the project in a single structure.
Clearly Defined
You can not come up with high-quality deliverables if there is room for ambiguity. A good chart clearly mentions all work packages, responsibilities, or phases. You should be able to define the terms used in the structure effortlessly.
Easy to Manage
The crux of having a structural tool is making management easier for you. If the chart doesn't make things easier and faster, you might need to reconsider working with that structure.
EdrawMax
All-in-One Diagram Software
- Superior file compatibility: Import and export drawings to various file formats, such as Visio
- Cross-platform supported (Windows, Mac, Linux, Web)
Gives Accurate Estimate
While breaking down a big project into smaller milestones, you will have to ensure that each milestone is compatible with the available resources. A good performing WBS chart gives an accurate estimate of the time and resources spent on a specific task.
Can be Precisely Measured
Lastly, a quick giveaway of an efficient structure is the fact that all the mentioned goals and responsibilities are measurable to an extent. This makes the whole chart measurable and easy to track. You will be able to quantify the progress of your gig at each level precisely.
4. How to Create WBS Charts
Now comes the part where you dive into creating a WBS chart. An excellent structure having all the mentioned above characteristics might sound challenging to make, but here EdrawMax and tips that will help you get through the process quite smoothly:
Step1 Deciding the Topmost Hierarchy in the structure
Start the formation of a WBS by determining the statement for your project. This statement will serve as the final deliverable at the top of the structural hierarchy.
Step2 Assigning the Lower Levels
Now is the time to decide which type of structure you are finalizing. Next, you will want to carefully divide the project into a list of deliverables, responsibilities, or phases under the task.
After the formation of lower levels, assign each task to someone with the required skills and resources to deliver it on time.
Step3 Putting things into Visuals
Next in the process is the step many managers struggle to keep up with because of the additional requirement of good design skills. However, getting a WBS project management template never disappoints in making things faster.
To make a stellar structure, you need to have an excellent template available for free on an online platform called EdrawMax. This can be your go-to platform for all kinds of project management resources.
Step4 Testing Your Chart
Lastly, check the efficiency of your chart by putting it to the test. Then, use this model for your next project management gig and find the difference yourself.
Want a detailed tutorial? Go to How to Draw a Network Topology Diagram and learn more!
5. The Bottom Line
The right project management strategies, like WBS charts, can exponentially boost your productivity. You will be able to handle more projects monthly or weekly, which will add to your profit margins and revenue. Moreover, knowing valuable strategies and EdrawMax will help you be a better manager in the long run.
EdrawMax
All-in-One Diagram Software
- Superior file compatibility: Import and export drawings to various file formats, such as Visio
- Cross-platform supported (Windows, Mac, Linux, Web, Android, iOS)

Project Management Network Diagram Complete Guide
Check this complete guide to know everything about the network diagram, like network diagram types, network diagram symbols, and how to make a network diagram.
You May Also Like
What is Mesh Topology
Knowledge
IT Organization Chart Complete Guide
Knowledge
Matrix Org Chart Complete Guide
Knowledge
