Complete Guide to Arrow Diagram
What is an Arrow Diagram
An arrow diagram is a visual representation of a project or process that needs a particular sequence to be completed successfully. While drawing an arrow diagram, it is important to keep the sequence in mind and illustrate the order to get the expected outcome within a certain timeframe.
With that said, the following sections explain in detail the arrow diagrams, their significance, what key points must be considered while preparing an arrow diagram, and how to create one using one of the best and easiest drawing tools available in the market today.
Purpose and Benefit
The purpose of an arrow diagram is to visually demonstrate the sequence in which a task needs to be performed to accomplish a goal. The target could be anything from designing a simple process of accepting orders of meals from the customers and their successful delivery to manufacturing a complex machine or device.
The benefit of preparing such a diagram is to illustrate the step-by-step process and to determine how much time would it take to get to the final output. For instance, if you want to start a business of manufacturing a motor engine, with the help of a detailed and efficiently created arrow diagram, you can assess the sequence that each department must follow to complete their part, and how much time would be required to get the complete engine up and running that could be made available to the consumers.
What to Do before Creating an Arrow Diagram
An arrow diagram gives a clear picture of the sequence in a procedure that needs to be followed alright. However, there are a couple of prerequisites that need to be met before you can dive into preparing such an illustration. Some of the important points worth considering in this context include:
1) In-Depth Knowledge
If you are planning to get something done, it is assumed that you already have in-depth knowledge of the process, and that you have a fairly good idea as to how the work flows. Without such a deep understanding of the procedure, it would be next to impossible to draw an accurate arrow diagram.
2) Understanding of Domain-Specific Jargons
Even though an arrow diagram uses some globally accepted symbols and shapes, labeling them as per your industry is imperative.
3) Timestamps
The arrows that you use in the diagram to illustrate a sequence must be numbered correctly, and if required, along with the tenure as to how much time would be expected to complete one step before moving to the next.
4) Automation (with an Effective Tool)
Although an arrow diagram can be drawn on a large sheet of paper using colored markers, with all the PC programs available in the market, it is strongly advisable to use an app that can help you prepare an error-free chart with the least resources and less time. Here, it is recommended to use EdrawMax by Wondershare, that is one of the best computer applications appreciated by many consumers across the globe.
How to Make an Arrow Diagram in EdrawMax
As mentioned earlier, EdrawMax is developed by an IT giant, Wondershare. The program is not merely helpful in creating several arrow diagrams, but it is a complete drawing tool that can be used to prepare almost all types of technical and non-technical illustrations including those for automobile engineering, building constructions, computer networking, software development, organizational charts, flowcharts, and much more.
Furthermore, in addition to allowing you to create diagrams and charts from the scratch, EdrawMax is also populated with several templates for almost all the categories. These stencils can be used as guides to build your diagrams based on them, thus saving yourself a decent amount of time.
To make an arrow diagram in Wondershare EdrawMax, you can follow the steps given below:
Step 1: Pick a Template
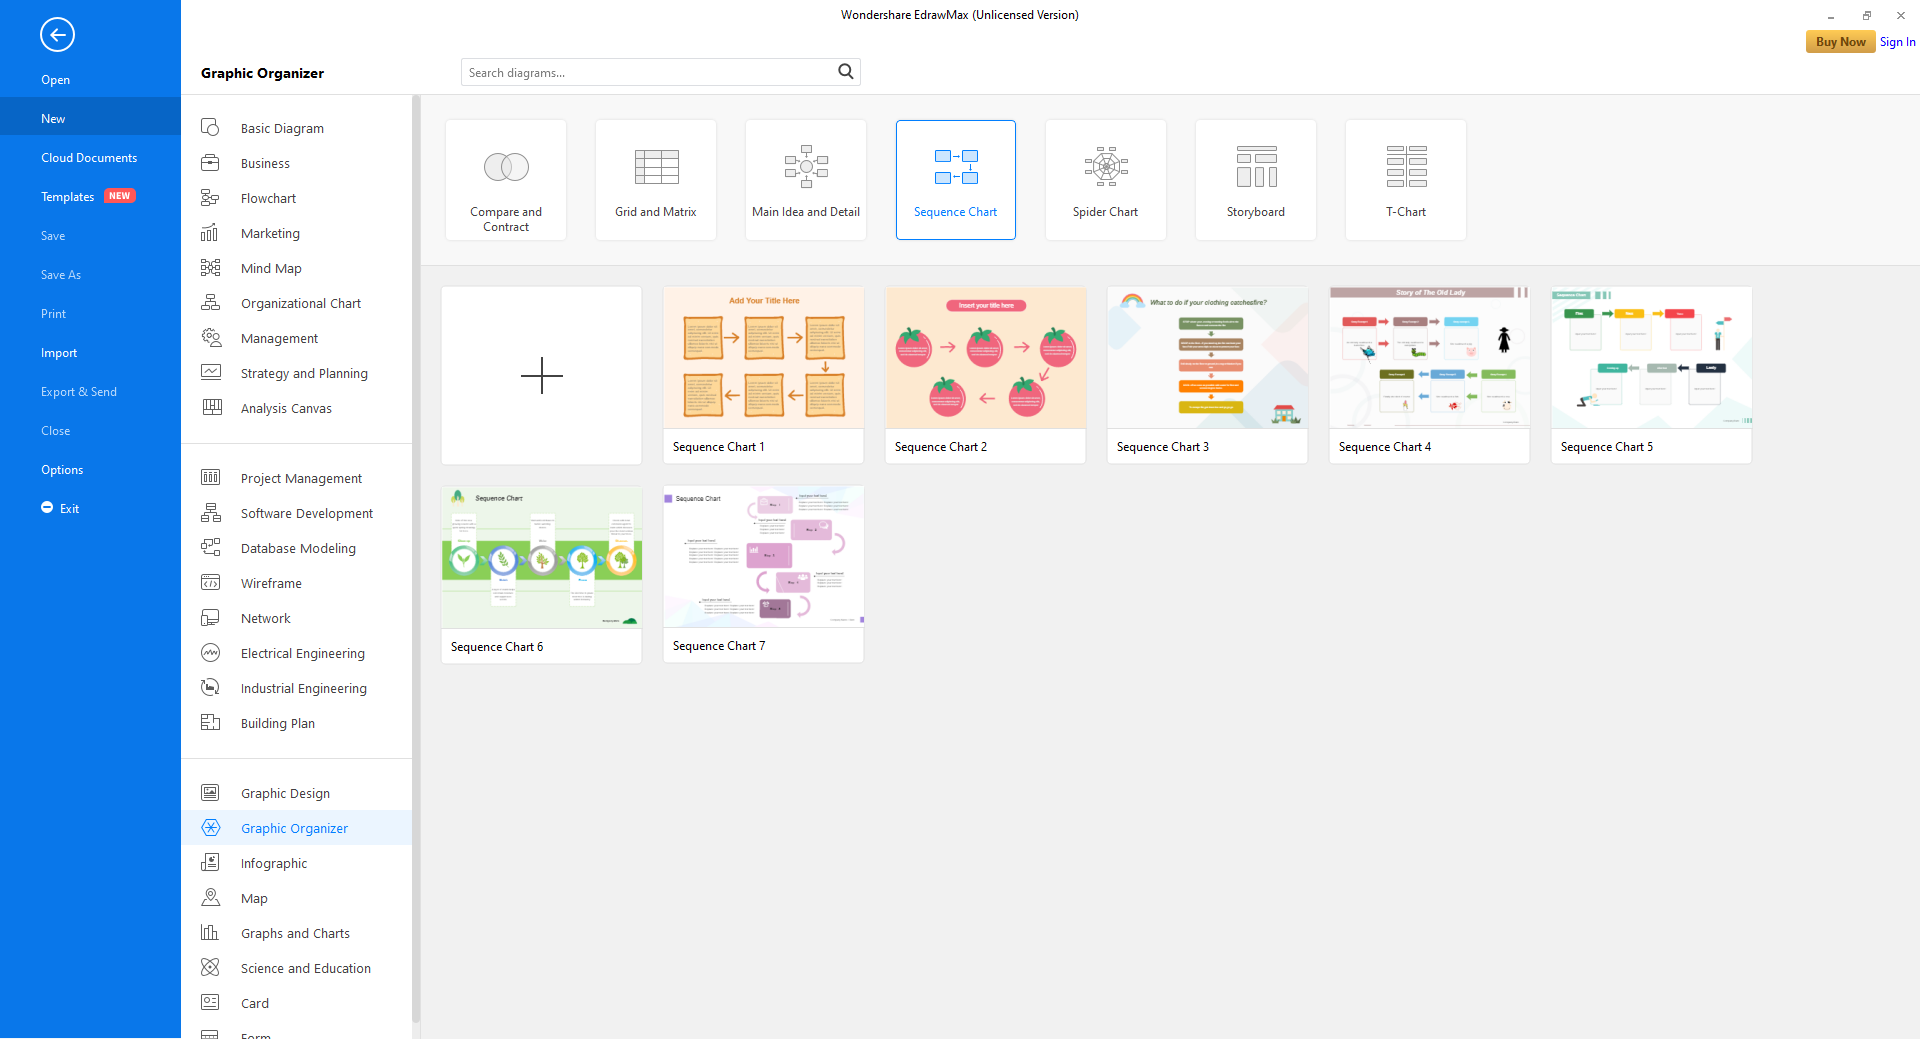
Launch Wondershare EdrawMax on your PC, make sure that New is selected in the navigation bar in the left, click to select Graphic Organizer from the chart type list in the middle, and click Sequence Chart from the top row in the right window. To choose a template, click to select the one of your choice from the lower section of the right window itself. Sequence Chart 2 is selected here for simplicity.
Step 2: Label the Shapes
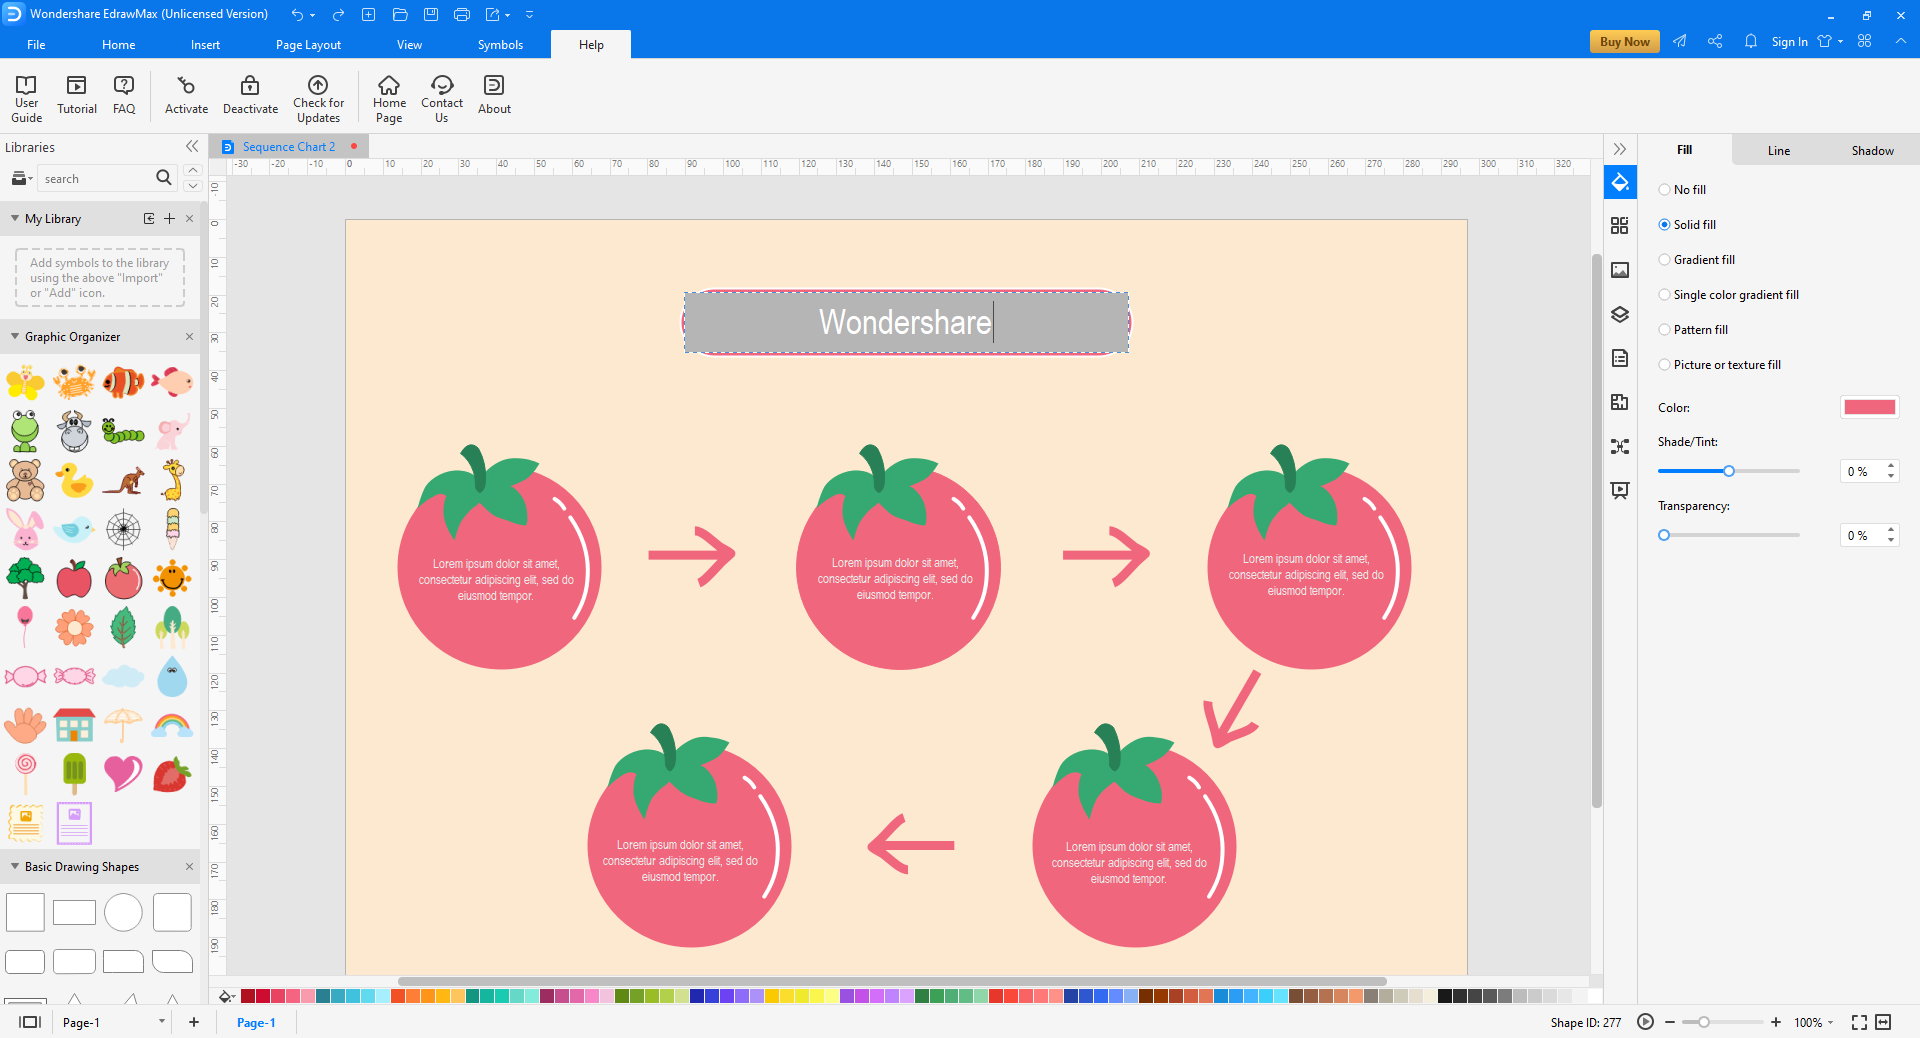
Double-click the first shape present in the canvas, and replace the placeholder text with your domain-specific caption/jargon. Repeat this process for all the available shapes.
Step 3: Make Required Modifications to the Diagram
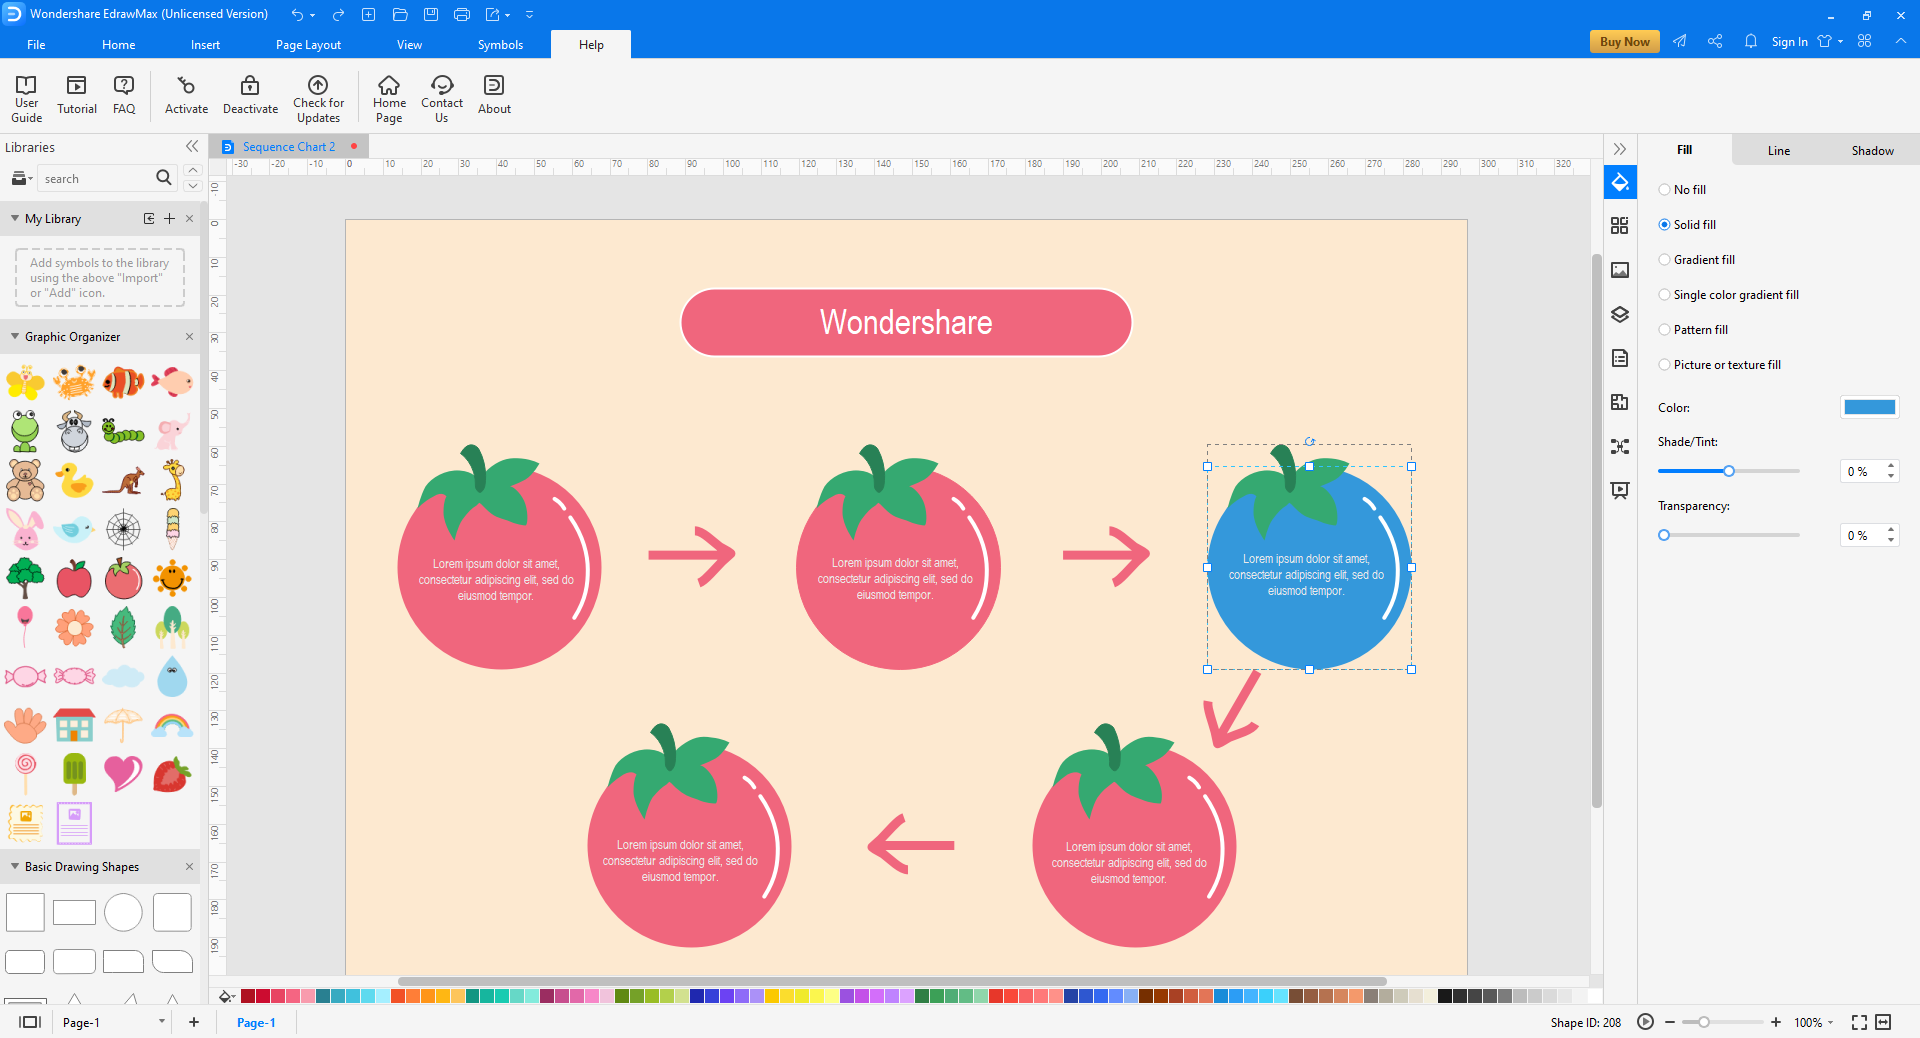
If need be, add more shapes to the diagram by dragging them from the library on the left, and dropping them on the canvas. Likewise, you can even make modifications in the shapes such as changing their color, adding or removing drop-shadows, etc. by using the tools available in the right pane.
Step 4: Save and Export the Arrow Diagram
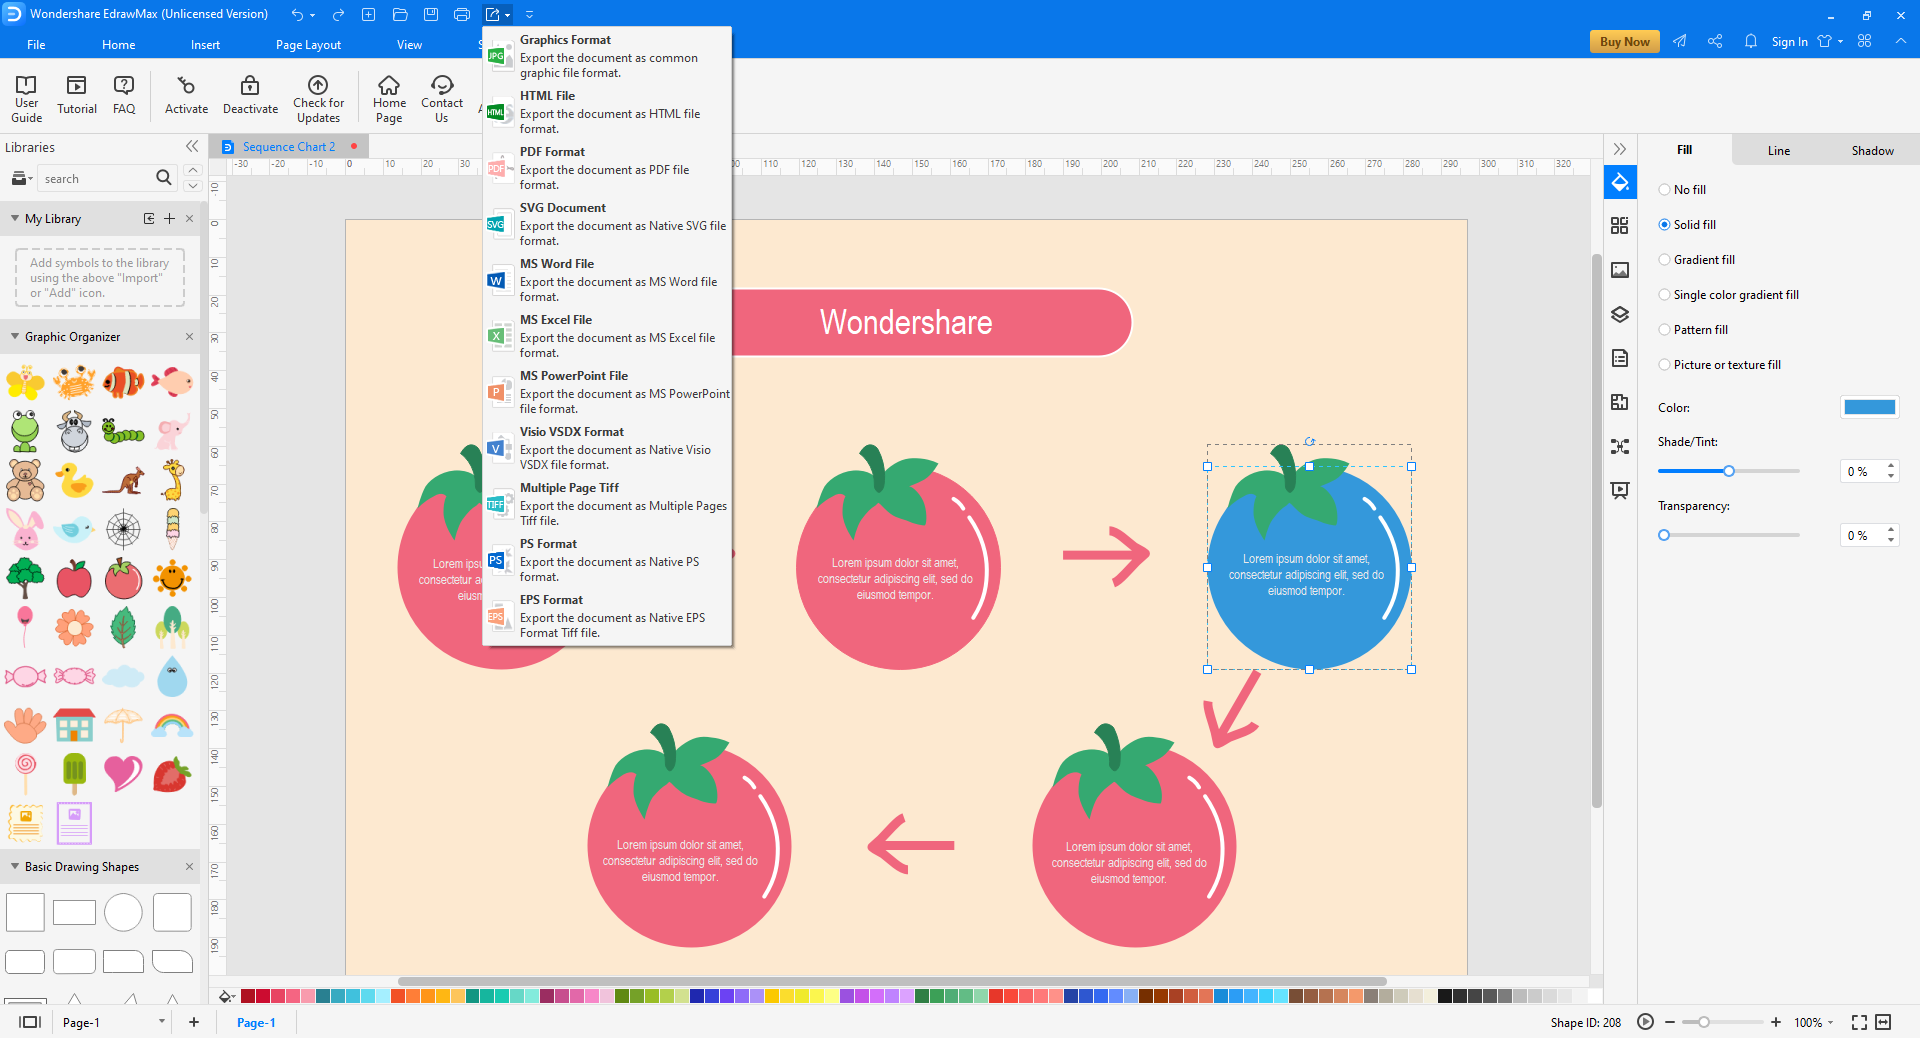
Once your arrow diagram is complete, you can click the Save icon from the quick access toolbar at the top-left corner of the interface, and save the illustration to your preferred folder on your PC. After this, you can click the More button on the Export icon on the same toolbar, and choose your preferred output format to export the drawing to.
Tips for Making an Arrow Diagram
After learning the significance and the process of preparing an arrow diagram, having a few tips on how to prepare an efficient chart handy would be a wise idea. Some best practices to keep in mind are:
- Make sure to keep the diagram as detailed as possible, but at the same time, in the simplest form
- Label each shape correctly
- Avoid using short forms of the technical words
- Elaborate the domain-specific jargons in layman’s language wherever needed (maybe within round brackets)
- Draw large shapes so they are evidently visible
- Export the arrow diagram in a globally acceptable format (PNG or JPG is recommended)
Arrow Diagram Example
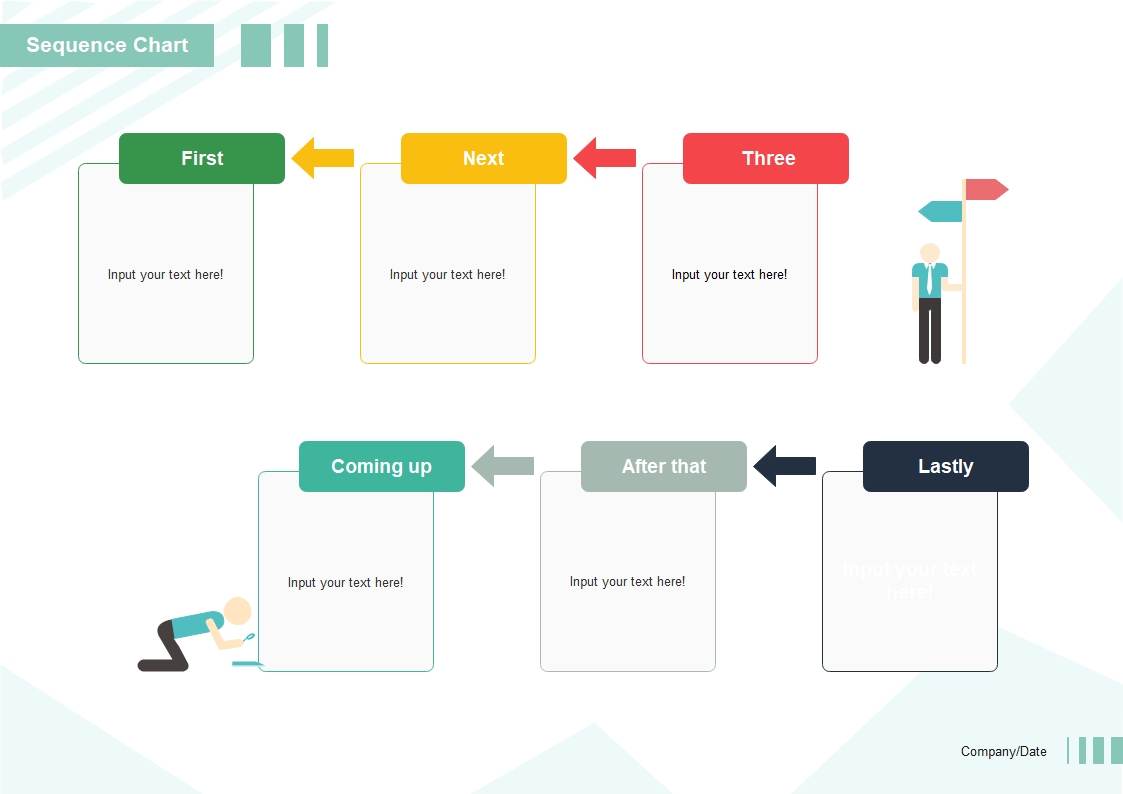
The above arrow diagram template can be used to illustrate the order of a simple or complex process. The symbol of a man working in each row tells the sequence the people involved in the procedure need to work in. However, if need be, the direction of each arrow can be reversed (or changed to a different direction) for better understanding.
Conclusion
A well-drawn arrow diagram could be one of the most helpful illustrations when it comes to accomplishing a particular task that is not only timebound but also requires a specific sequence to get the final output up and running. Although such a chart can be prepared manually, using an efficient tool like Wondershare EdrawMax surely saves you a decent amount of time, while eliminating the chances of errors and flaws that could otherwise occur if the plan is created by hand.


