Area Chart Maker
Create excellent area charts for free with easy-to-edit templates and spreadsheet editor.
Trusted By Over 25 Million Users & Leading Brands


Why EdrawMax to Make Your Area Charts?
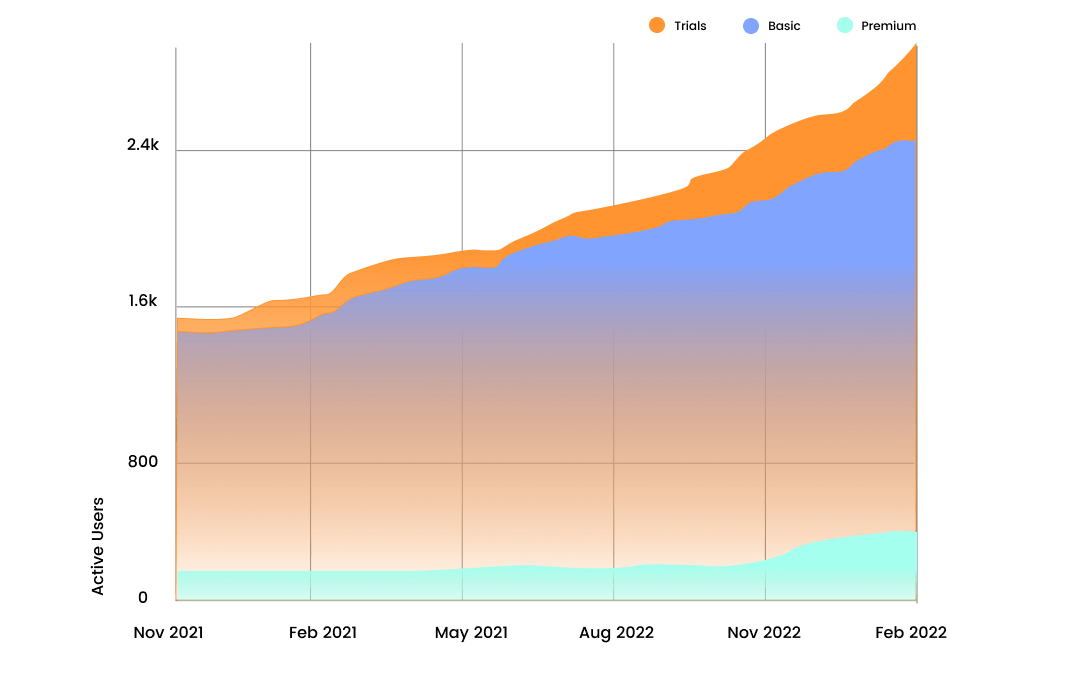
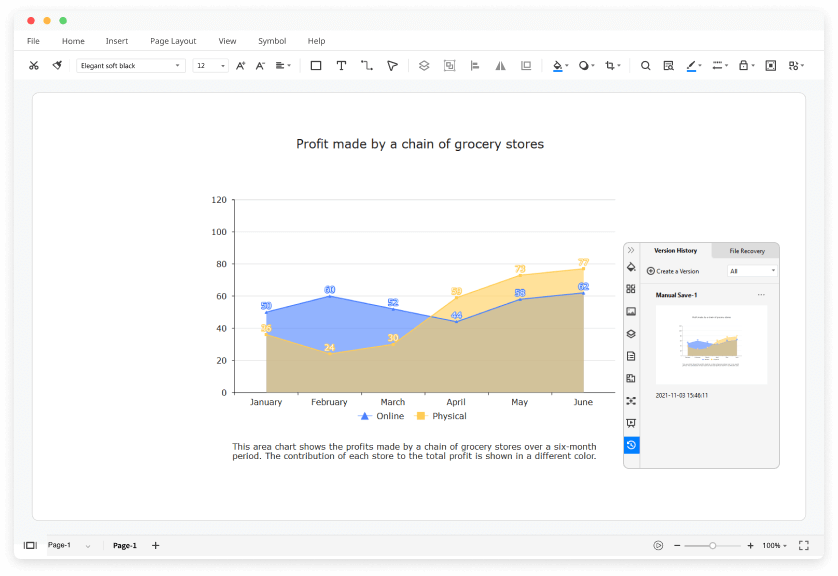
Visualize the comparison
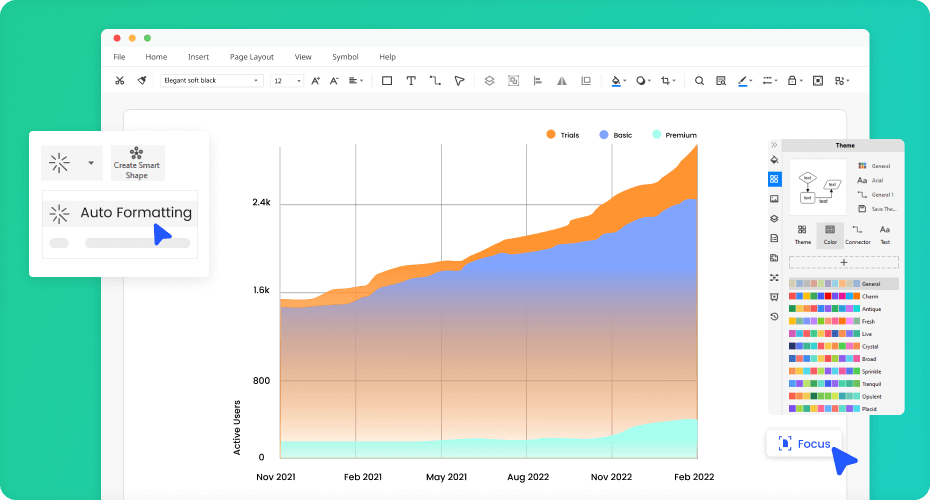
Creating area charts is a breeze
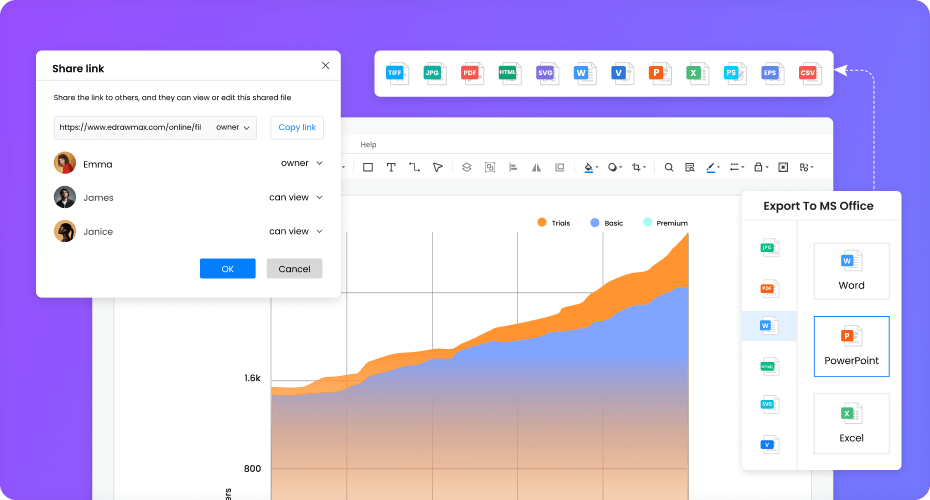
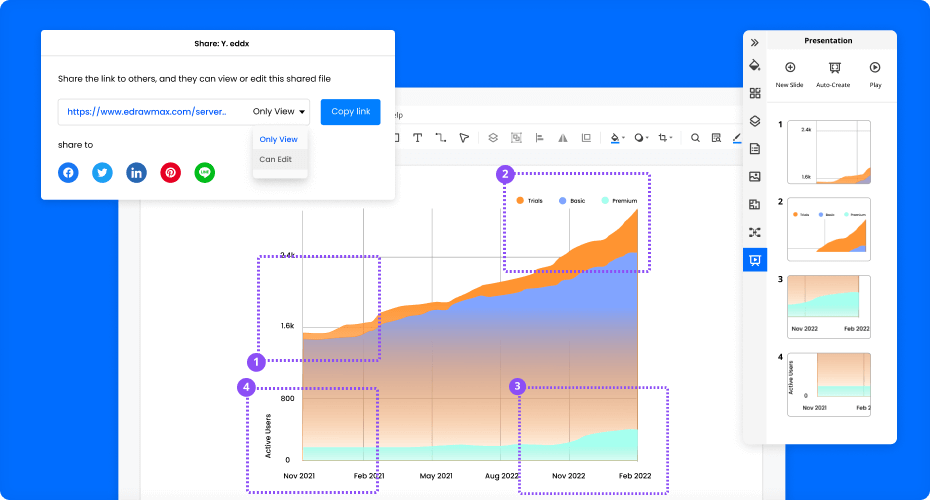
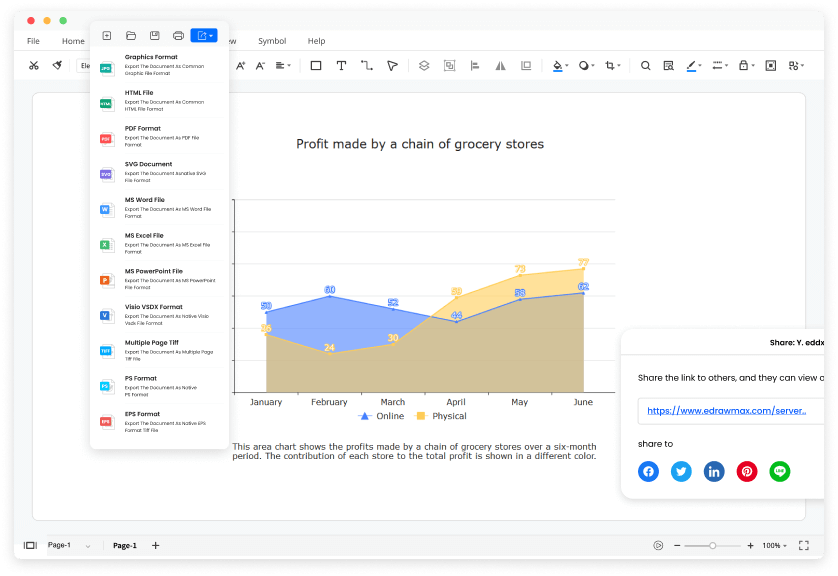
Easy downloading and sharing
Present like an expert
More Features Of Area Chart Maker
Visio files import and export
Customized fonts and shapes
Insert images and attachments
Infinitive canvas
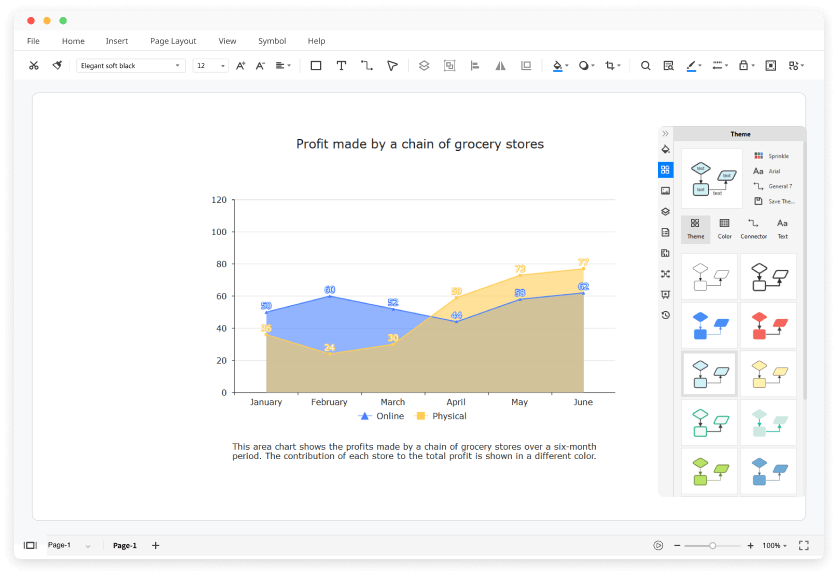
Various color theme
File encryption and file backup
How to Make a Area Chart?
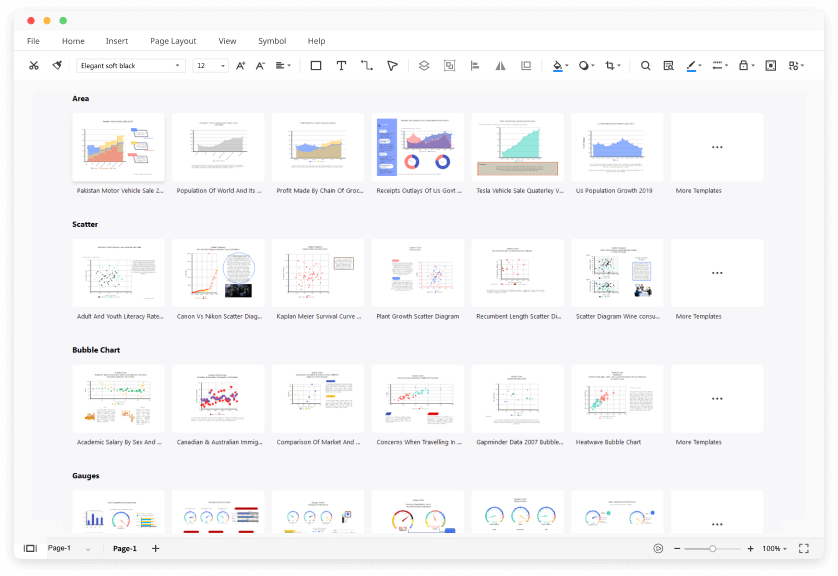
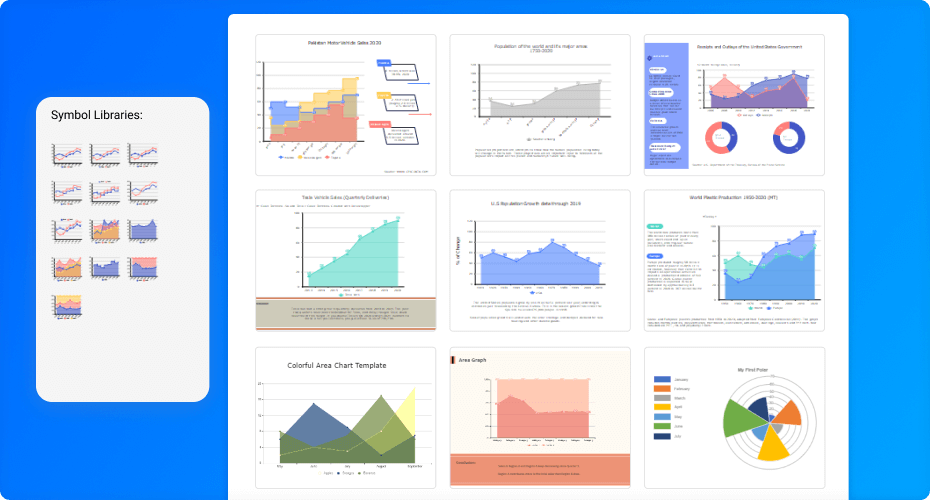
Edraw Area Chart Templates
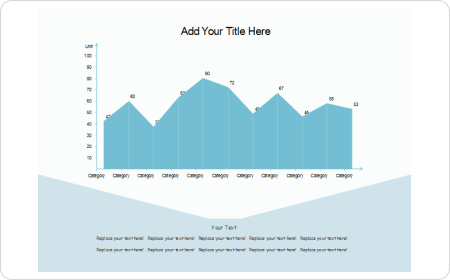
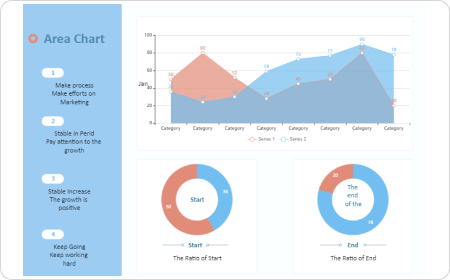
Area Graph
An area graph displays the quantitative data based on the line chart and compares two or more quantities.
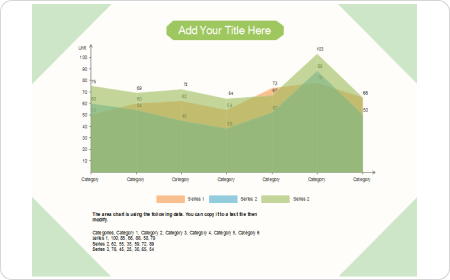
Stacked Area Chart
A stacked area chart displays the evolution of groups' values on the same graph.
Area Chart in Excel
There is no inbuilt chart for the area chart in Excel, but we can make it using the line chart.
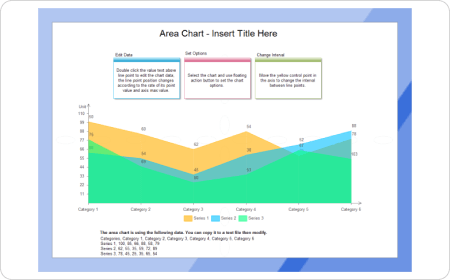
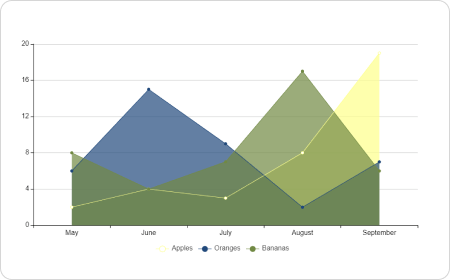
Area Chart Example
An area chart shows the cars and bike sales over the 15 years. Different colors represent both.
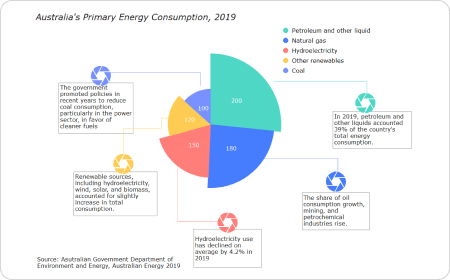
Polar Area Chart
A polar area chart resembles a pie chart. Each segment has the same angle, but the radius differs depending on the value.
Area Chart Tableau
An area chart that is created via Tableau by using the professionally made area chart layout for the Tableau users.
Area Chart FAQs

Does EdrawMax have any free area chart templates?
Except for the pre-made area chart templates in EdrawMax, you can download and customize templates from our Template Community. All the community-made templates are free to use for Edrawers.
How can I share my area charts with others who don't use EdrawMax?
When your area chart is complete, you can post it on social media, publish on Edraw Template Community, or export the file as Word, Excel, PowerPoint, Visio, PDF, SVG, PNG and JPG. EdrawMax is dedicated to delivering a superior user experience.
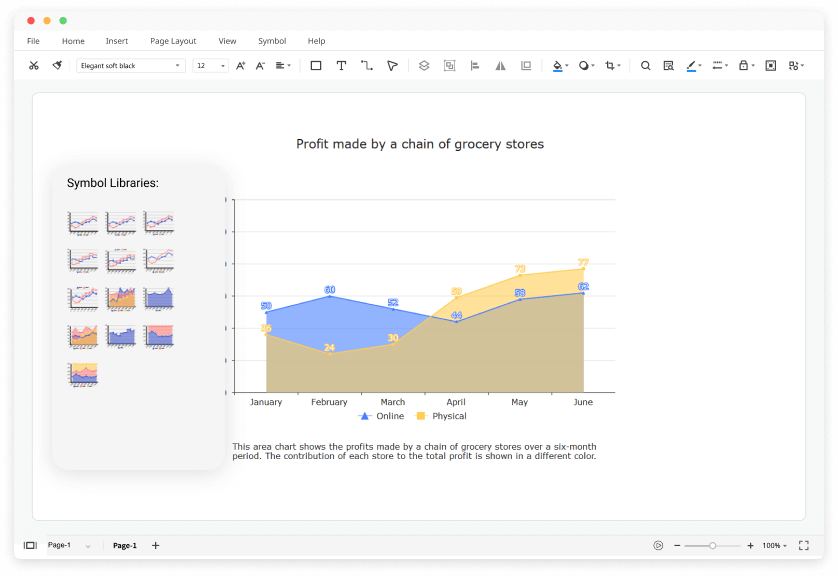
How can I find area chart symbols that I need?
No worries. You can find area chart symbols by opening and searching in the preset symbol libraries of EdrawMax.
How can I create an area chart from scratch?
You can create an area chart from scratch by dragging and dropping symbols from the libraries and customizing colors, fonts, lines, etc. All the symbols in EdrawMax are vector, editable, and catered to different types of area charts.
Is EdrawMax's area chart maker free?
YES! It is free to create different area charts in EdrawMax. There are free templates, symbols, and easy-to-use editing tools for making area charts. Just download it and try EdrawMax now. You will love it right now.
More Resources
Unlock your diagram possibilities by exploring more diagram makers here.
Find more ideas, tips and knowledge to help create area charts.
Need help? Find the instruction or contact support here.