Simple Boston Matrix Maker - Make Great-looking Boston Matrix

Find out why Edraw is the best Boston matrix maker: Download it Now.
Definition of Boston Matrix
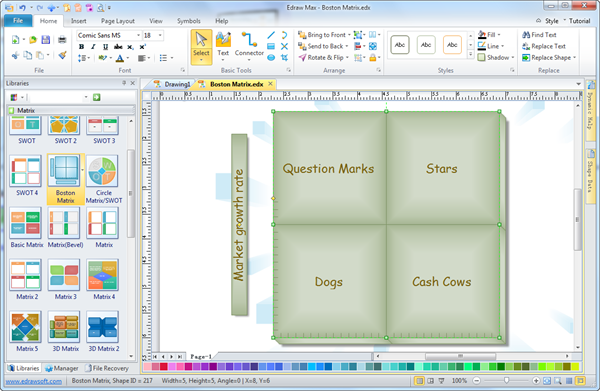
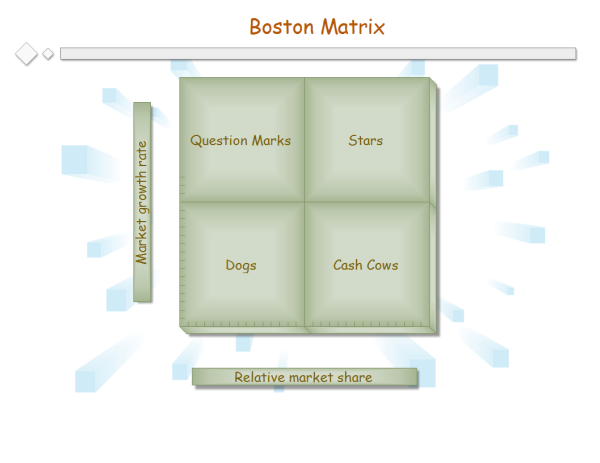
Boston matrix is used to allocate resources in brand marketing, product management and portfolio analysis. It shows the various business units on a graph of the market growth rate VS. market share related to competitors. The 4 categories of business are: Dogs; Question marks; Stars; Cash cows. According to their location on the graph, different units are allocated with different portion of resources.
- Cash Cow - A mature unit which has a large market share, growing slowly. It need little investment but generates cash which can be used in other units.
- Star - A unit with large market share, growing fast, requires investment to maintain its lead. A star may become a cash cow when it becomes mature if managed successfully.
- Question Marks - This unit has low market share compared with competitors, but it is doing business in high-growth market. This market is growing with opportunities as well as risk involved with investing - so these businesses are called question marks. Question Marks require continuous investment and improvement for their development and growth.
- Dog - This is a business unit with small market in a mature industry. It needs not substantial cash investment but straps capital which could be invested in other units. If there is no other strategic purpose, it has to be liquidated when there is little hope to gain market share from it.
The Edraw Boston Matrix maker can build a framework for easy comparison of different business units at a glance. It requires no learning curve while provides out-of-the-box tools. No prior knowledge and artistic skill are demanded while comfort and enjoyment are offered.
With Edraw Boston Matrix maker, you will surely enjoy the creating process as well as marvel at the high quality results.
Simple Boston Matrix Maker - Make Great-looking Boston Matrix
Edraw Boston Matrix maker is used to help visually represent data for report or presentation. For those already accustomed with other Microsoft apps such as Word or Excel, the interface will be very familiar. Simply drag and drop symbols, apply built-in designed themes, and automatically share your finished Boston matrix into a presentation or PDF with one click .
System Requirements
Works on Windows 7, 8, 10, XP, Vista and Citrix
Works on 32 and 64 bit Windows
Works on Mac OS X 10.2 or later
Features Beyond Expectation
The following features are beyond your expectation and will lead to results more than you expect.


