Data Flow Model Diagram Software

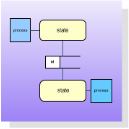
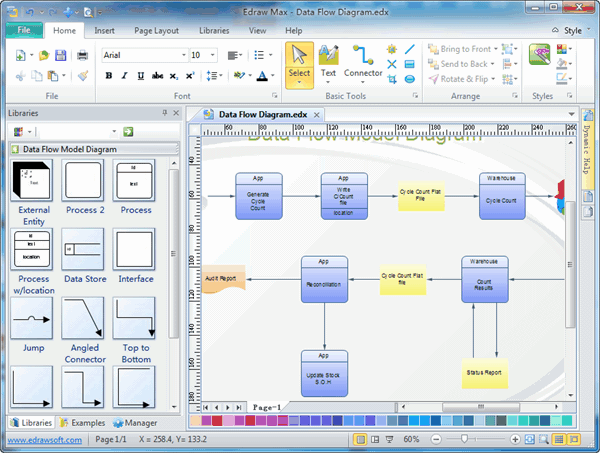
It contains special shapes and settings for creating data flow model diagrams or diagrams of public exposed interfaces, COM interfaces, and OLE interfaces in object-oriented programming.
EdrawMax
All-in-One Diagram Software
- Superior file compatibility: Import and export drawings to various file formats, such as Visio
- Cross-platform supported (Windows, Mac, Linux, Web, Android, iOS)
Data Flow Model Diagram Software
EdrawMax is not only an excellent tool for database & ER Diagram, but also one that allows you to design flowchart, program structures, create detailed HTML or PDF reports.

System Requirements
Top Features of Data Flow Model Diagram Software
- A full DFD toolset for drawing a DFD you want effortlessly.
- No obligation. Free trial. Free support.
- No prior drawing experience required.
- Fast generation of DFD through predefined symbols.
- Quick start from ready-made DFD templates.
- Seamless integration with MS programs. Flexible export with broad file format compatibility.
Who Need Data Flow Model Diagram
- Software designers: Model how data is processed by a system using Gane-Sarson (DFD) notation.
- Software developers: Write pseudo-code for an existing process data flow.
- Development managers: Describe nested layers of data flow throughout systems.
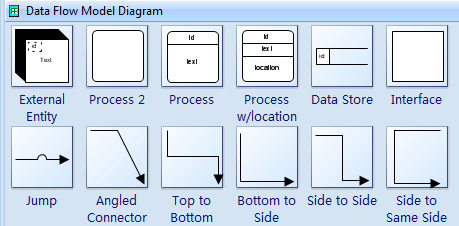
Data Flow Model Diagram Symbols
The following templates are described with respect to these conventions. These EdrawMax templates include nodes with a sub-paging feature that facilitates creating subordinate diagrams and navigating multi-tiered models after a design has been completed.

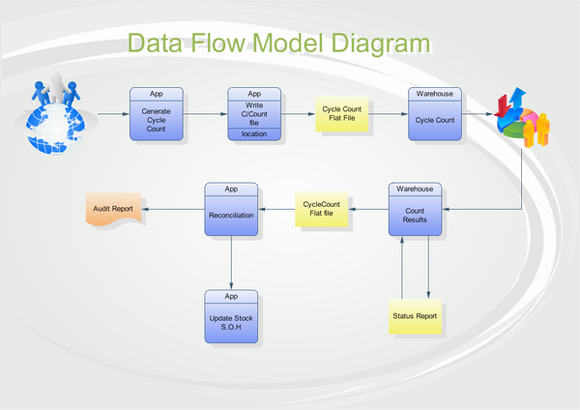
Examples of Data Flow Model Diagram

Data Model Flow Diagram
The formal, structured analysis approach employs the data-flow diagram (DFD) to assist in the functional decomposition process. It conquers advanced structured analysis techniques, and those techniques are representative of present conventions. To summarize, DFD's are comprised of four components:
- External interactors are represented by a rectangle.
- Data stores are displayed by an open rectangle (2 or 3 sides).
- Processes are represented by any rounded object (a circle, oval, or square with rounded corners). A DFD process may represent system function at one of various levels, atomic through aggregate.
- Data flows are represented by arrows, with labels indicating their content.
Relative Resource
How to Draw a Database Model Diagram
How to Draw Data Flow Diagrams
Linux Data Flow Diagram Software to Draw Data Flow Diagram with Free Examples


